Dead Cat Bounce Didn’t Last [Video]
![Dead Cat Bounce Didn’t Last [Video]](https://editorial.fxstreet.com/images/Markets/Currencies/Majors/DollarIndex/rows-of-dollars-bundles-background-19722556_XtraLarge.jpg)
US Dollar: Sept USD is Down at 97.290.
Energies: Sept '19 Crude is Up at 52.58.
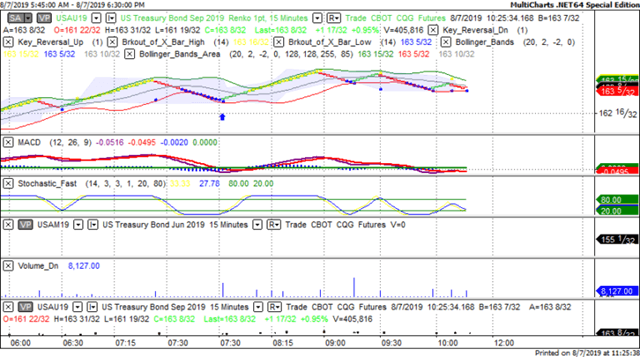
Financials: The Sept 30 year bond is Down 33 ticks and trading at 161.06.
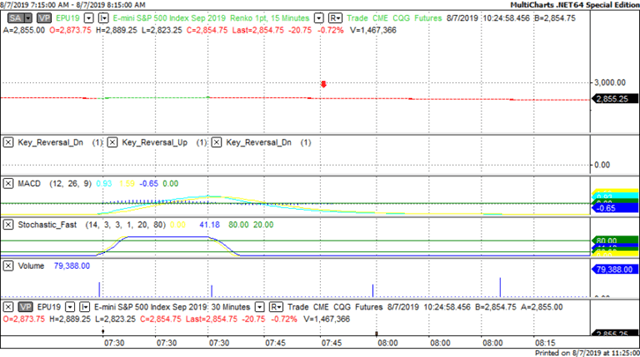
Indices: The Sept S&P 500 emini ES contract is 28 ticks Higher and trading at 2887.50.
Gold: The Dec Gold contract is trading Down at 1509.50 Gold is 101 ticks Lower than its close.
Initial Conclusion
This is not a correlated market. The dollar is Up+ and Crude is Down- which is normal and the 30 year Bond is trading Higher. The Financials should always correlate with the US dollar such that if the dollar is lower then bonds should follow and vice-versa. The S&P is Higher and Crude is trading Higher which is not correlated. Gold is trading Lower which is correlated with the US dollar trading Up. I tend to believe that Gold has an inverse relationship with the US Dollar as when the US Dollar is down, Gold tends to rise in value and vice-versa. Think of it as a seesaw, when one is up the other should be down. I point this out to you to make you aware that when we don't have a correlated market, it means something is wrong. As traders you need to be aware of this and proceed with your eyes wide open.
Currently Asia is trading mainly Higher with the exception of the Aussie and Sigapore exchanges. At this time all of Europe is trading to the Upside except the Milan exchange which is Lower.
Possible Challenges To Traders Today
-
Unemployment Claims is out at 8:30 AM EST. This is major.
-
Final Wholesale Inventories m/m is out at 10 AM EST. This is major.
-
Natural Gas Storage is out at 10:30 AM EST. This is major.
-
30-y Bond Auction starts at 1PM EST. This is major.
Treasuries
We've elected to switch gears a bit and show correlation between the 30 year bond (ZB) and The YM futures contract. The YM contract is the DJIA and the purpose is to show reverse correlation between the two instruments. Remember it's liken to a seesaw, when up goes up the other should go down and vice versa.
Yesterday the ZB made a major move at around 8 AM EST. The ZB hit a Low at around that time and the YM hit a High. If you look at the charts below ZB gave a signal at around 8 AM EST and the YM was moving Lower at the same time. Look at the charts below and you'll see a pattern for both assets. ZB hit a Low at around 8 AM and the YM was moving Lower at the same time. These charts represent the newest version of MultiCharts and I've changed the timeframe to a 15 minute chart to display better. This represented a Long opportunity on the 30 year bond, as a trader you could have netted about 20 plus ticks per contract on this trade. Each tick is worth $31.25. Please note: the front month for both the ZB and YM contract is now September, 2019 and I've changed the format to Renko bars such that it may be more apparent and visible.
Charts Courtesy of MultiCharts built on an AMP platform
Bias
Yesterday we gave the markets a Neutral bias which means the markets could go in any direction. The markets traded Mixed as the Dow dropped 22 points but the S&P and Nasdaq did show a slight gain. Today we aren't dealing with a correlated market however our bias is to the Upside.
Could this change? Of Course. Remember anything can happen in a volatile market.
Commentary
Yesterday we discussed the Dead Cat Bounce but unfortunately it didn't carry over into Wednesday's trading as the Dow dropped 22 points. Typically a Dead Cat Bounce is a reflex as the markets lost so much ground and dropped so low that a rebound is inevitable. That plus covering short trades doesn't hurt either. In terms of market movers today we have Unemployment Claims out at 8:30 AM EST. This is usual for a Thursday but will it be enough to drive the markets forward?
Author

Nick Mastrandrea
Market Tea Leaves


