Dead cat bounce

USD: Mar '25 is Down at 109.510.
Energies: Feb '25 Crude is Down at 77.04.
Financials: The Mar '25 30 Year T-Bond is Up 1 tick and trading at 110.28.
Indices: The Mar '25 S&P 500 emini ES contract is 70 ticks Higher and trading at 5891.50.
Gold: The Feb'25 Gold contract is trading Up at 2680.90.
Initial conclusion
This is not a correlated market. The USD is Down and Crude is Down which is not normal, and the 30 Year T-Bond is trading fractionally Higher. The Financials should always correlate with the US dollar such that if the dollar is Higher, then the bonds should follow and vice-versa. The S&P is Higher and Crude is trading Lower which is correlated. Gold is trading Higher which is correlated with the US dollar trading Down. I tend to believe that Gold has an inverse relationship with the US Dollar as when the US Dollar is down, Gold tends to rise in value and vice-versa. Think of it as a seesaw, when one is up the other should be down. I point this out to you to make you aware that when we don't have a correlated market, it means something is wrong. As traders you need to be aware of this and proceed with your eyes wide open. Asia traded Mixed. Europe is trading Higher with the exception of the London exchange which is trading Lower.
Possible challenges to traders
-
NFIB Small Business Index is out at 6 AM EST. This is Major.
-
Core PPI is out at 8:30 AM EST. This is Major.
-
PPI is out at 8:30 AM EST. This is Major.
-
FOMC Member Scmidt Speaks at 10 AM EST. This is Major.
-
Federal Budget Balance is out at 2 PM EST. This is Major.
-
FOMC Member Williams Speaks at 3:05 PM EST. This is Major.
Traders, please note that we've changed the Bond instrument from the 10 year (ZN) to the 2 year (ZT). They work exactly the same.
We've elected to switch gears a bit and show correlation between the 2-year Treasury notes (ZT) and the S&P futures contract. The YM contract is the Dow Jones Industrial Average, and the purpose is to show reverse correlation between the two instruments. Remember it's likened to a seesaw, when up goes up the other should go down and vice versa.
On Monday the ZT migrated Higher at around 7 AM EST with no economic news in sight. The Dow moved Lower at the same time. Look at the charts below and you'll see a pattern for both assets. The Dow moved Lower at 7 AM EST and the ZT moved Higher at around the same time. These charts represent the newest version of Bar Charts, and I've changed the timeframe to a 15-minute chart to display better. This represented a Long opportunity on the 2-year note, as a trader you could have netted 20 plus ticks per contract on this trade. Each tick is worth $7.625. Please note: the front month for ZT is now Mar '25 and the Dow is now Mar '25. I've changed the format to filled Candlesticks (not hollow) such that it may be more apparent and visible.
Charts courtesy of BarCharts
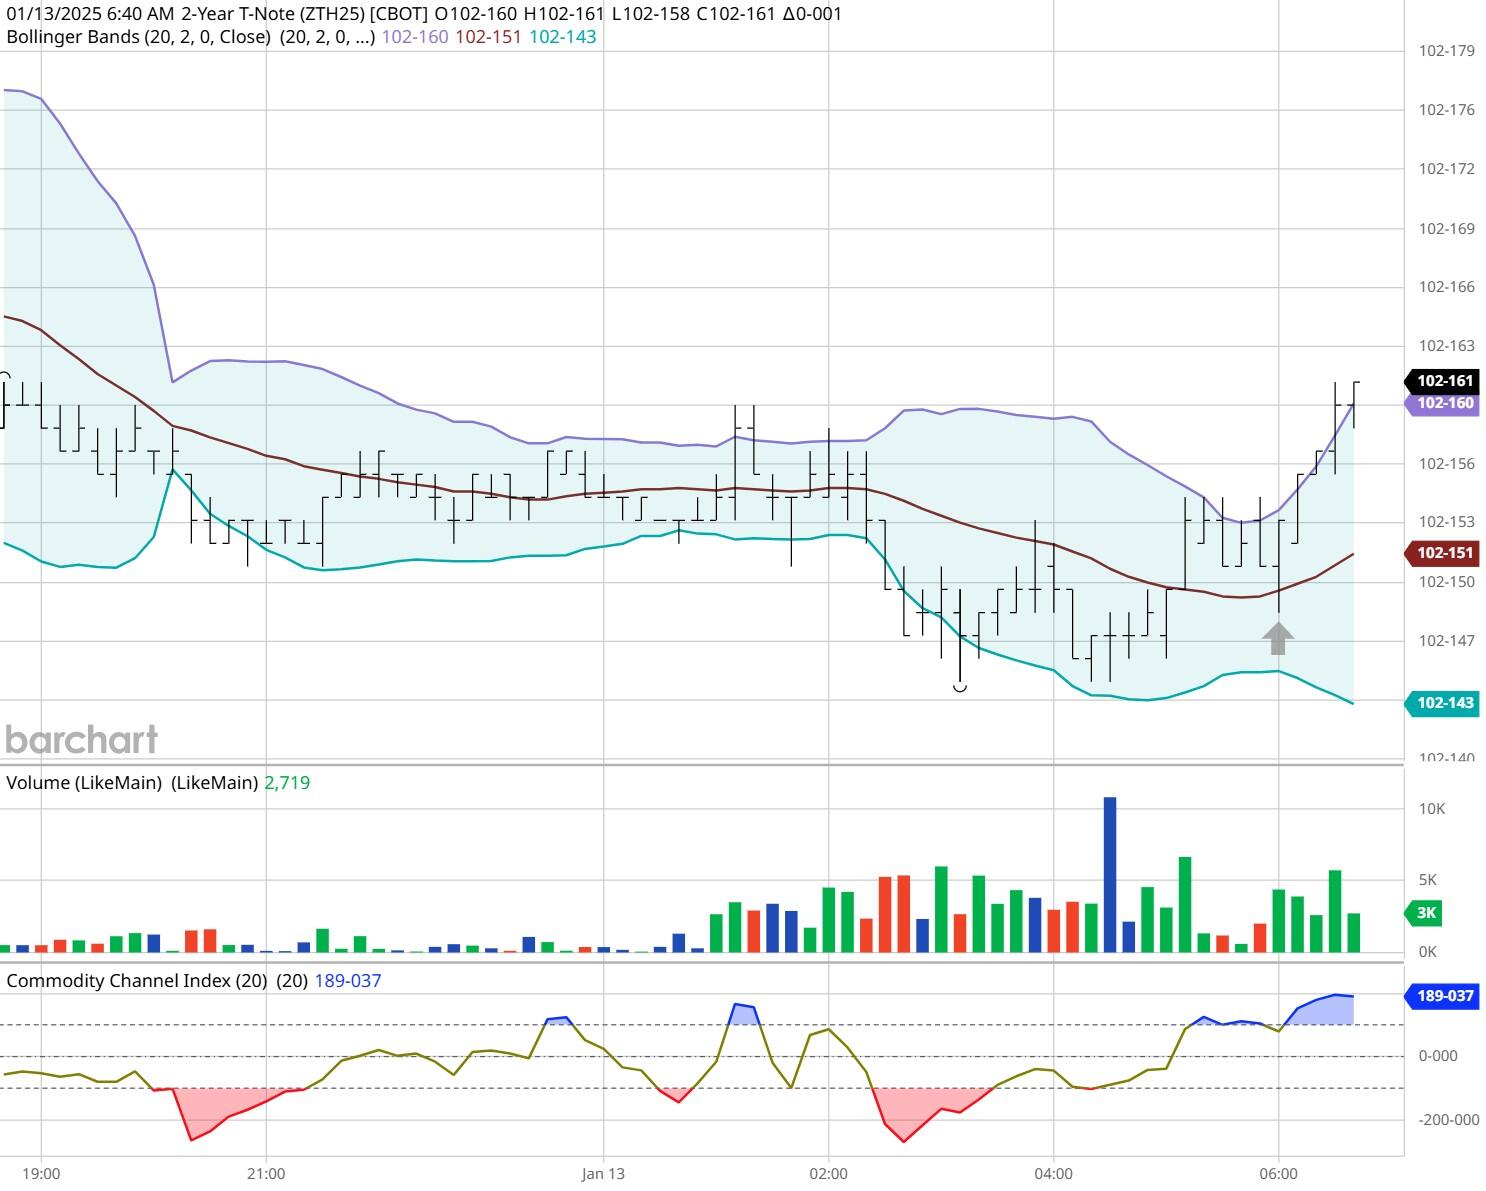
ZT -Mar 2025 - 1/13/25
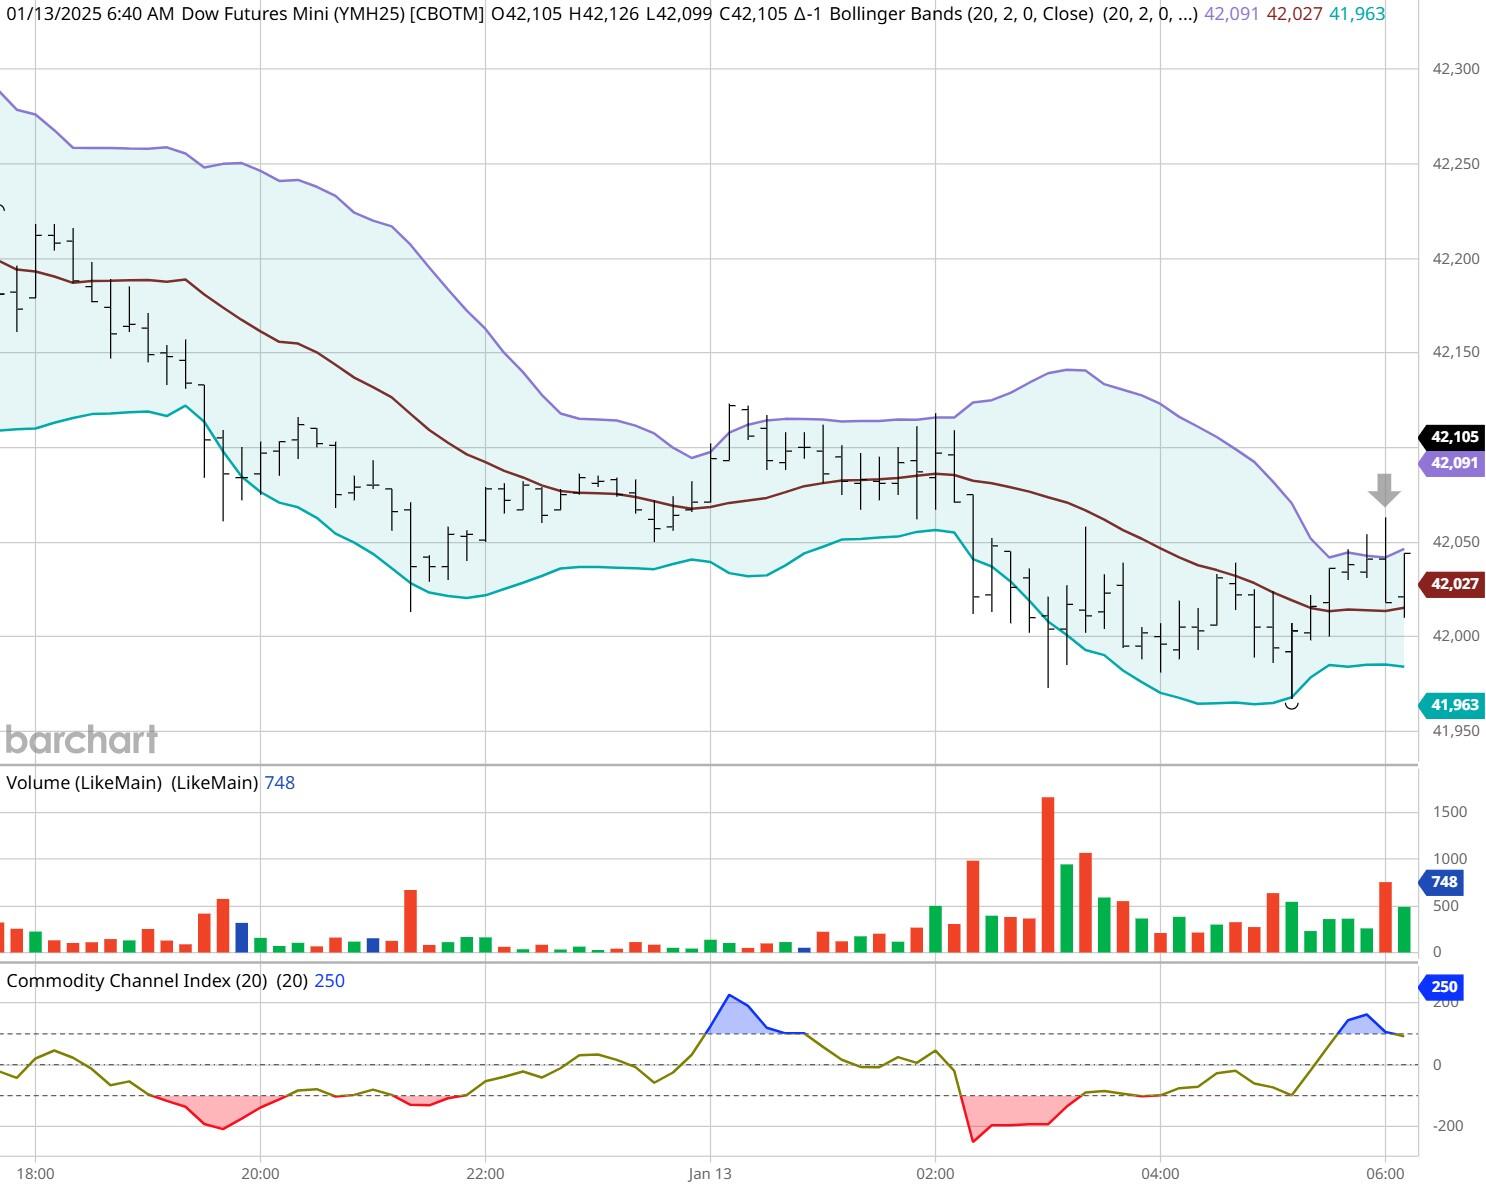
Dow - Mar 2025- 1/13/25
Bias
Yesterday we gave the markets a Downside bias as both the USD and Crude were pointed Higher Monday morning and that usually represents a Downside Day. The markets had other ideas as both the Dow and the S&P traded Higher while the Nasdaq closed Lower. Today we aren't dealing with a correlated market and our bias is to the Upside.
Could this change? Of Course. Remember anything can happen in a volatile market.
Commentary
Yesterday the markets were poised to go Lower but instead two of the three major indices traded Higher with only the Nasdaq trading Lower. So what happened? This is typical of a Dead Cat Bounce which occurs when the markets have traded Lower for a period of time and then migrates in the opposite direction due to short covering. In other words the market is going lower and traders are shorting the market thinking it will continue to the downside and then short covering kicks in, and the market migrates in the opposite direction. Today we have the all important PPI numbers which will tell the Fed if it's wise to continue reducing interest rates. PPI is likened to CPI for component and raw material manufacturers.
Author

Nick Mastrandrea
Market Tea Leaves


