Dead Cat Bounce
US Dollar: Mar. USD is Up at 89.515.
Energies: Mar ’18 Crude is Up at 63.62.
Financials: The Mar 30 year bond is Up 4 ticks and trading at 146.05.
Indices: The Mar S&P 500 emini ES contract is 93 ticks Lower and trading at 2671.00.
Gold: The Feb gold contract is trading Up at 1332.30. Gold is 28 tick Higher than its close.
Initial Conclusion
This is not a correlated market. The dollar is Up+ and Crude is Up+ which is not normal and the 30 year Bond is trading Higher. The Financials should always correlate with the US dollar such that if the dollar is lower then bonds should follow and vice-versa. The S&P is Lower and Crude is trading Up+ which is correlated. Gold is trading Up+ which is not correlated with the US dollar trading Up+. I tend to believe that Gold has an inverse relationship with the US Dollar as when the US Dollar is down, Gold tends to rise in value and vice-versa. Think of it as a seesaw, when one is up the other should be down. I point this out to you to make you aware that when we don’t have a correlated market, it means something is wrong. As traders you need to be aware of this and proceed with your eyes wide open.
At this hour Asia is trading mainly Lower with the exception of the Aussie and Nikkei exchanges which are higher. As of this writing all of Europe is trading Higher.
Possible Challenges To Traders Today
-
FOMC Member Dudley Speaks at 8:30 AM. This is major.
-
Mortgage Delinquencies. This is major.
-
Crude Oil Inventories is out at 10:30 AM EST. This is major.
-
10-y Bond Auction starts at 1 PM EST. This is major.
-
Consumer Credit m/m is out at 3 PM EST. This is major.
Treasuries
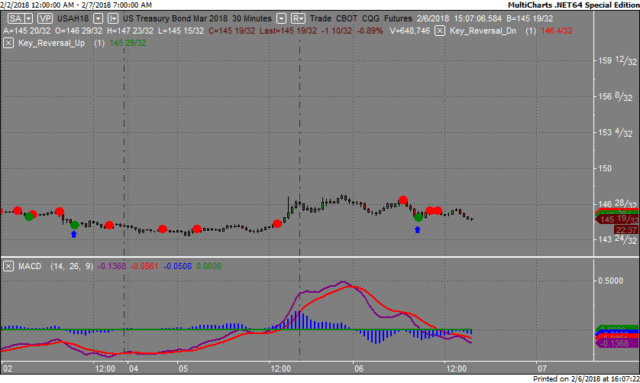
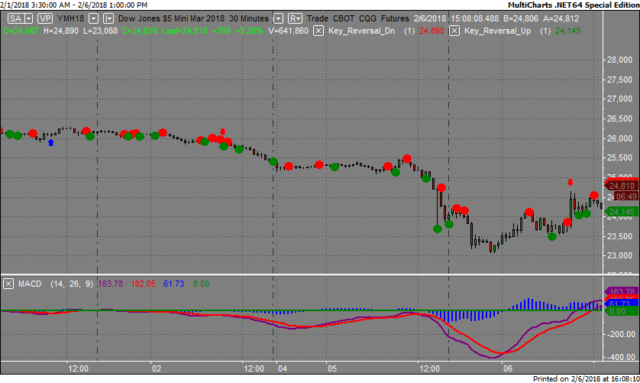
We’ve elected to switch gears a bit and show correlation between the 30 year bond (ZB) and The YM futures contract. The YM contract is the DJIA and the purpose is to show reverse correlation between the two instruments. Remember it’s liken to a seesaw, when up goes up the other should go down and vice versa.
Yesterday the ZB made it’s move at around 9 AM EST with no real economic news in sight. The ZB hit a Low at around that time and the YM hit a High. If you look at the charts below ZB gave a signal at around 9 AM EST and the YM was moving Lower at the same time. Look at the charts below and you’ll see a pattern for both assets. ZB hit a Low at around 9 AM and the YM hit a High. These charts represent the newest version of MultiCharts and I’ve changed the timeframe to a 30 minute chart to display better. This represented a long opportunity on the 30 year bond, as a trader you could have netted about 20 ticks per contract on this trade. Each tick is worth $31.25.
Charts Courtesy of MultiCharts built on an AMP platform.
Bias
Yesterday we gave the markets an Upside bias and the markets responded accordingly. The Dow gained 567 points and the other indices gained ground as well. Today we aren’t dealing with a correlated market and our bias is to the Downside.
Could this change? Of Course. Remember anything can happen in a volatile market.
Commentary
Yesterday we gave the markets an Upside bias and guess what? The markets gained. We hate to say we told you so but we did tell you. Some of you may be wondering how did we come to that conclusion when the Bonds and Gold were trading Higher yesterday morning and this is usually indicative of a Downside day. The answer is we’ve been around the markets for over 20 years now and we’ve seen a dead cat bounce in the past. Yesterday had all the making of a dead cat bounce and thus it was.
Author

Nick Mastrandrea
Market Tea Leaves


