Good Morning Traders,

As of this writing 4:10 AM EST, here’s what we see:

US Dollar: Sept. USD is Up at 94.505.
Energies:
Jul '18 Crude is Down at 66.79.
Financials:
The Sept 30 year bond is Up 18 ticks and trading at 143.27.
Indices:
The Sept S&P 500 emini ES contract is 46 ticks Lower and trading at 2770.00.
Gold:
The Aug gold contract is trading Down at 1303.50. Gold is 50 ticks Lower than its close.

Initial Conclusion

This is not a correlated market. The dollar is Up+ and Crude is Down- which is normal and the 30 year Bond is trading Higher. The Financials should always correlate with the US dollar such that if the dollar is lower then bonds should follow and vice-versa. The S&P is Lower and Crude is trading Lower which is not correlated. Gold is trading Down- which is correlated with the US dollar trading Up+. I tend to believe that Gold has an inverse relationship with the US Dollar as when the US Dollar is down, Gold tends to rise in value and vice-versa. Think of it as a seesaw, when one is up the other should be down. I point this out to you to make you aware that when we don't have a correlated market, it means something is wrong. As traders you need to be aware of this and proceed with your eyes wide open.

At this hour all of Asia is trading Lower with the exception of the Nikkei exchange which is Higher. Currently Europe is trading Mixed at this time.

Possible Challenges To Traders Today

  • Empire State Mfg Index is out at 8:30 AM EST. This is major.

  • Capacity Utilization Rate is out at 9:15 AM EST. This is major.

  • Industrial Production is out at 9:15 AM EST. This is major.

  • Prelim UoM Consumer Sentiment is out at 10 AM. Major.

  • Prelim UoM Inflation Expectations is out at 10 AM EST. Major.

  • TIC Long-Term Purchases is out at 4 PM EST. This is major.
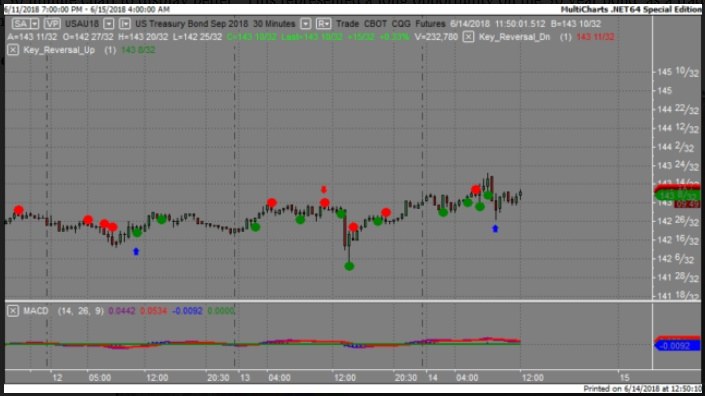
 Treasuries

We've elected to switch gears a bit and show correlation between the 30 year bond (ZB) and The YM futures contract. The YM contract is the DJIA and the purpose is to show reverse correlation between the two instruments. Remember it's liken to a seesaw, when up goes up the other should go down and vice versa.

Yesterday the ZB made it's move at around 9:30 AM EST. The ZB hit a Low at around that time and the YM hit a High. If you look at the charts below ZB gave a signal at around 9:30 AM EST and the YM was moving Lower at the same time. Look at the charts below and you'll see a pattern for both assets. ZB hit a Low at around 9:30 AM and the YM was moving Lower at the same time. These charts represent the newest version of MultiCharts and I've changed the timeframe to a 30 minute chart to display better. This represented a long opportunity on the 30 year bond, as a trader you could have netted about 20 plus ticks per contract on this trade. Each tick is worth $31.25.

Charts Courtesy of MultiCharts built on an AMP platform.

Correlation

Correlation

Bias

Yesterday we gave the markets a Downside bias as Crude, The Bonds and Gold were all trading Higher Thursday morning and this usually reflects a Downside day. The Dow dropped 26 points but the S&P and Nasdaq both logged gains for the session. Today we aren't dealing with a correlated market however our bias is to the Downside.

Could this change? Of Course. Remember anything can happen in a volatile market.

Commentary

As predicted the Dow dropped based on our rules of Market Correlation. It's never a good idea to hike interest rates when the economy is moving at full steam ahead as that has a way of derailing it over time. The global didn't like the news either as both Asia and Europe initially dropped. Europe recovered based on the news that the ECB was going to ween off stimulus starting year end. Today we have Empire State Manufacturing Index along with preliminary numbers for both Consumer Sentiment and Inflation Expectations. These are major and proven market movers.

Trading performance displayed herein is hypothetical. The following Commodity Futures Trading Commission (CFTC) disclaimer should be noted.

Hypothetical performance results have many inherent limitations, some of which are described below. No representation is being made that any account will or is likely to achieve profits or losses similar to those shown.

In fact, there are frequently sharp differences between hypothetical performance results and the actual results subsequently achieved by any particular trading program. One of the limitations of hypothetical performance trading results is that they are generally prepared with the benefit of hindsight.

In addition, hypothetical trading does not involve financial risk, and no hypothetical trading record can completely account for the impact of financial risk in actual trading. For example, the ability to withstand losses or to adhere to a particular trading program in spite of trading losses are material points which can also adversely affect actual trading results.

There are numerous other factors related to the markets in general or to the implementation of any specific trading program which cannot be fully accounted for in the preparation of hypothetical performance results and all of which can adversely affect actual trading results.

Trading in the commodities markets involves substantial risk and YOU CAN LOSE A LOT OF MONEY, and thus is not appropriate for everyone. You should carefully consider your financial condition before trading in these markets, and only risk capital should be used.

In addition, these markets are often liquid, making it difficult to execute orders at desired prices. Also, during periods of extreme volatility, trading in these markets may be halted due to so-called “circuit breakers” put in place by the CME to alleviate such volatility. In the event of a trading halt, it may be difficult or impossible to exit a losing position.

Recommended Content


Recommended Content

Editors’ Picks

AUD/USD rises to two-day high ahead of Aussie CPI

AUD/USD rises to two-day high ahead of Aussie CPI

The Aussie Dollar recorded back-to-back positive days against the US Dollar and climbed more than 0.59% on Tuesday, as the US April S&P PMIs were weaker than expected. That spurred speculations that the Federal Reserve could put rate cuts back on the table. The AUD/USD trades at 0.6488 as Wednesday’s Asian session begins.

AUD/USD News

EUR/USD now refocuses on the 200-day SMA

EUR/USD now refocuses on the 200-day SMA

EUR/USD extended its positive momentum and rose above the 1.0700 yardstick, driven by the intense PMI-led retracement in the US Dollar as well as a prevailing risk-friendly environment in the FX universe.

EUR/USD News

Gold struggles around $2,325 despite broad US Dollar’s weakness

Gold struggles around $2,325 despite broad US Dollar’s weakness

Gold reversed its direction and rose to the $2,320 area, erasing a large portion of its daily losses in the process. The benchmark 10-year US Treasury bond yield stays in the red below 4.6% following the weak US PMI data and supports XAU/USD.

Gold News

Bitcoin price makes run for previous cycle highs as Morgan Stanley pushes BTC ETF exposure

Bitcoin price makes run for previous cycle highs as Morgan Stanley pushes BTC ETF exposure

Bitcoin (BTC) price strength continues to grow, three days after the fourth halving. Optimism continues to abound in the market as Bitcoiners envision a reclamation of previous cycle highs.

Read more

Australia CPI Preview: Inflation set to remain above target as hopes of early interest-rate cuts fade

Australia CPI Preview: Inflation set to remain above target as hopes of early interest-rate cuts fade

An Australian inflation update takes the spotlight this week ahead of critical United States macroeconomic data. The Australian Bureau of Statistics will release two different inflation gauges on Wednesday. 

Read more

Majors

Cryptocurrencies

Signatures