Dax holding first support at 12630/640 re-targets strong resistance at 12725/735

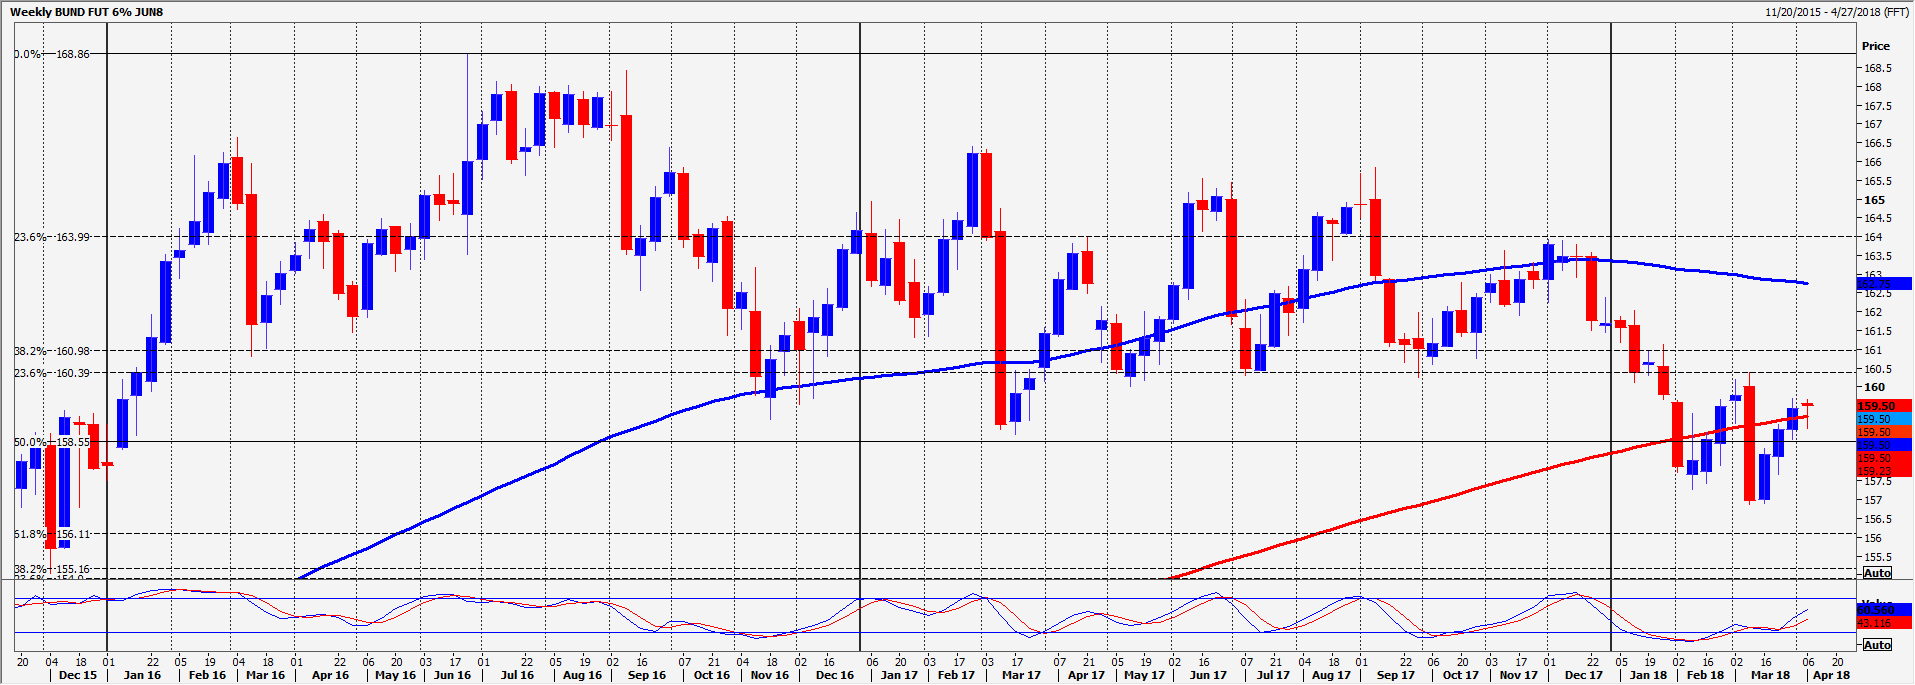
Bund September contract
Bund holding above 162.42/47 targets 162.70. On further gains look for 162.87/93, perhaps as far as 163.20/23 before the July high at 163.39.
Below 162.40 risks a slide 162.29/25. Below 162.20 today meets support at 162.00/05.
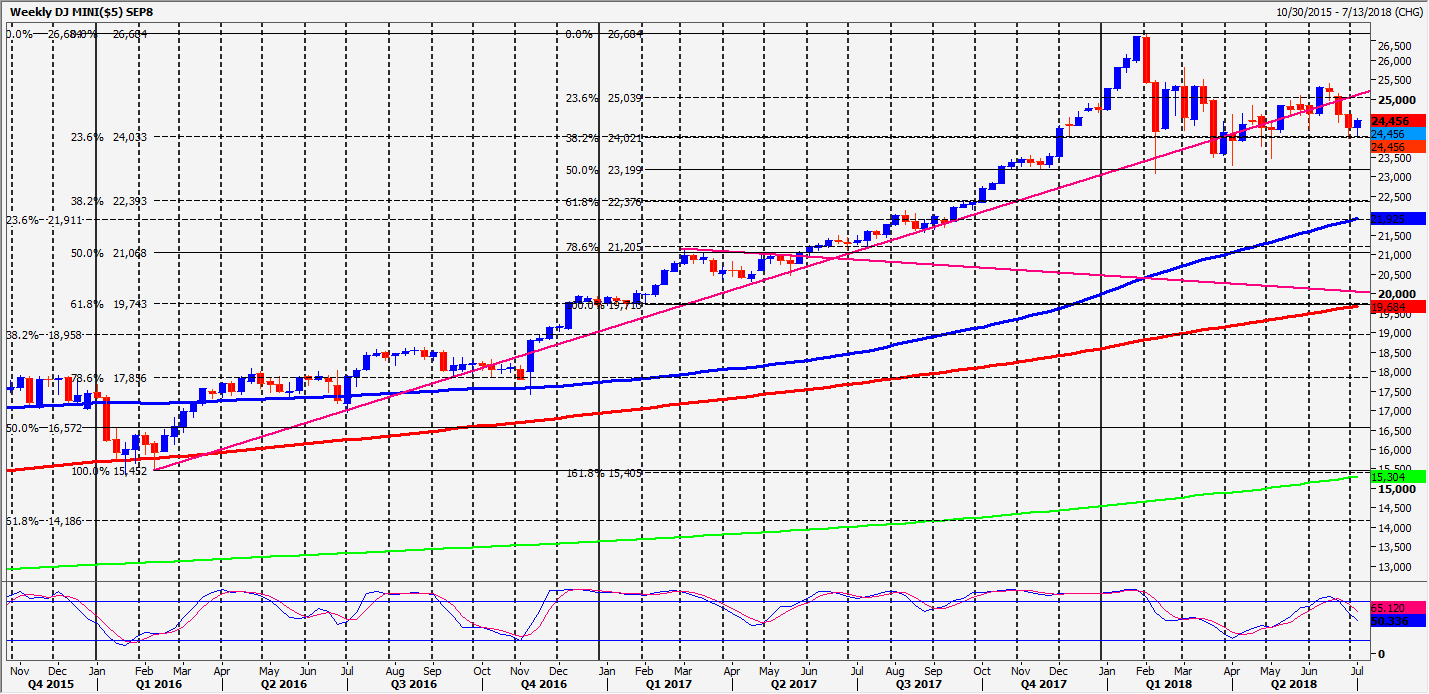
Emini Dow JonesSeptember contract
Emini Dow Jones small correction as we warned hitting 25535/525. Below 25500 as I write now to target better support at 25430/420 & bulls are buying the dip so a bounce from here looks likely, although we may only reach 25500/550. A break below 25390 is a minor sell signal targeting strong support at 25270/260 for profit taking on all shorts.
Holding above 25525 allows a recovery to 25590, perhaps as far as 25620/630. (We topped right in the middle yesterday). Gains are likely to be limited in severely overbought conditions but above 25661 targets 25680/690 & above 25700 look for 25800/810.
Dax September contract
Dax holding first support at 12630/640 re-targets strong resistance at 12725/735. Try shorts with stops above 12770 this time. A break higher targets 12810/830.
First support at 12630/640 but below 12600 is negative for today targeting 12570 & minor support at 12530/510. Below 12500 risks a slide to 12455 & 12400/390. A break below the 4 week low at 12376 targets 12350/345.

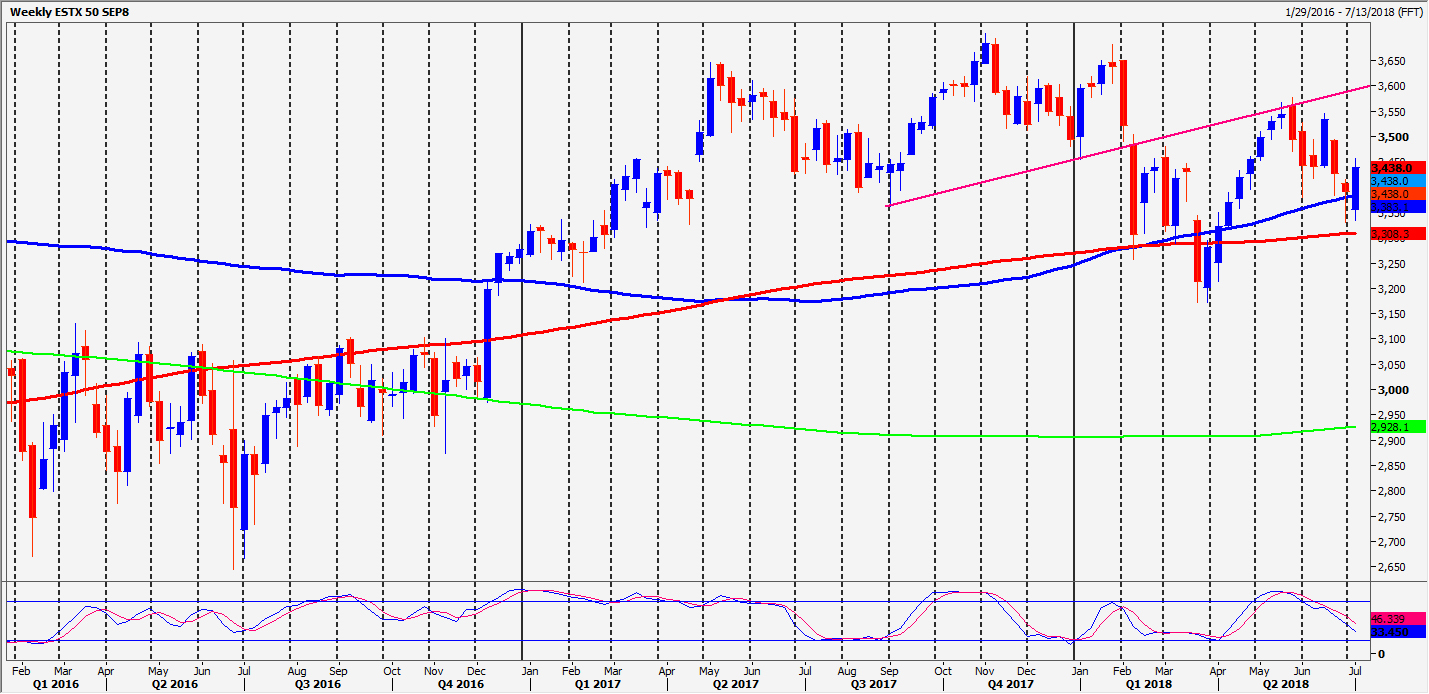
Eurostoxx September contract
EuroStoxx minor resistance at 3500/05. Above 3515 retests the high at 3530/33. A break higher tests the June high of 3545/46.
Below 3500 tests support at 3487/84. Below 3480 risks a test of good support at 3458/54. Below 3450 look for good support at 3430/25.
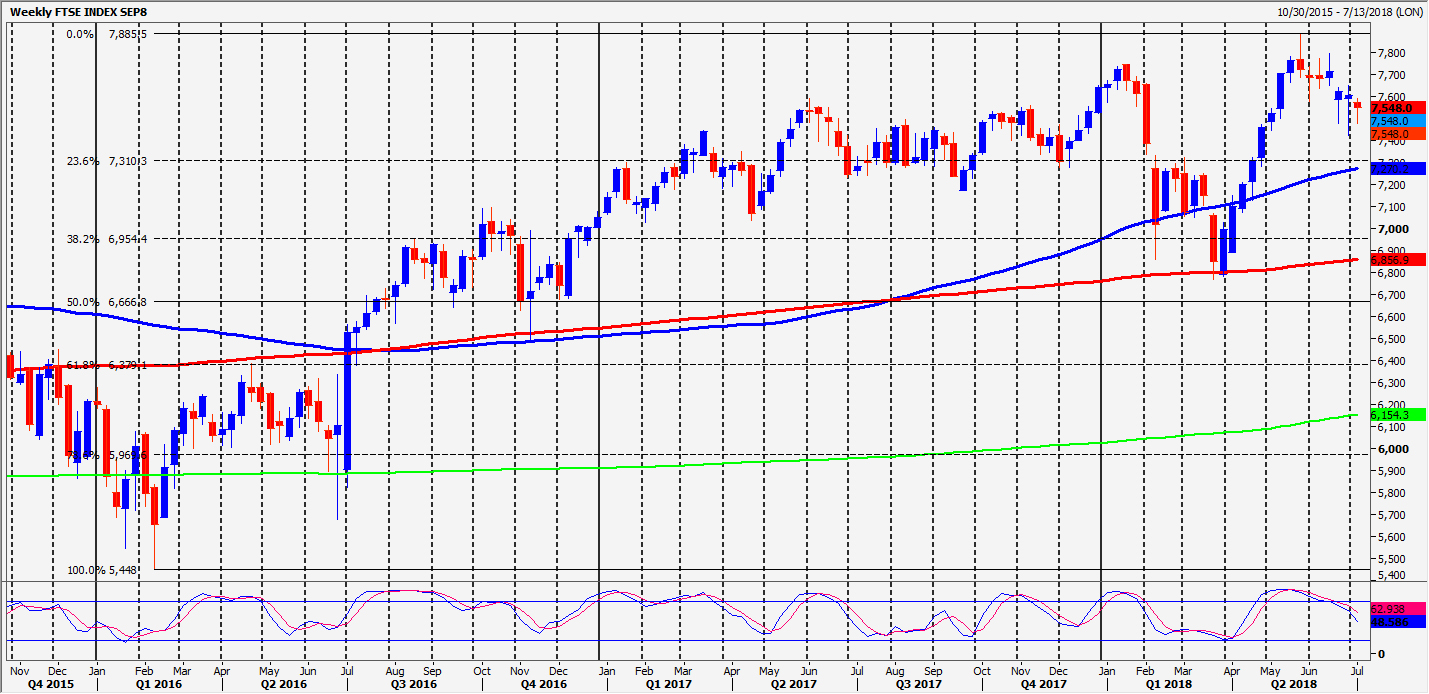
Ftse September contract
FTSE reached the next target of 7744/45 & topped half way to 7767/72. Weaker sterling is probably helping. If we continue higher look for 7795/99.
Minor support at 7715 but much better support at 7690/85. However below 7670 look for a buying opportunity at 7650/45.
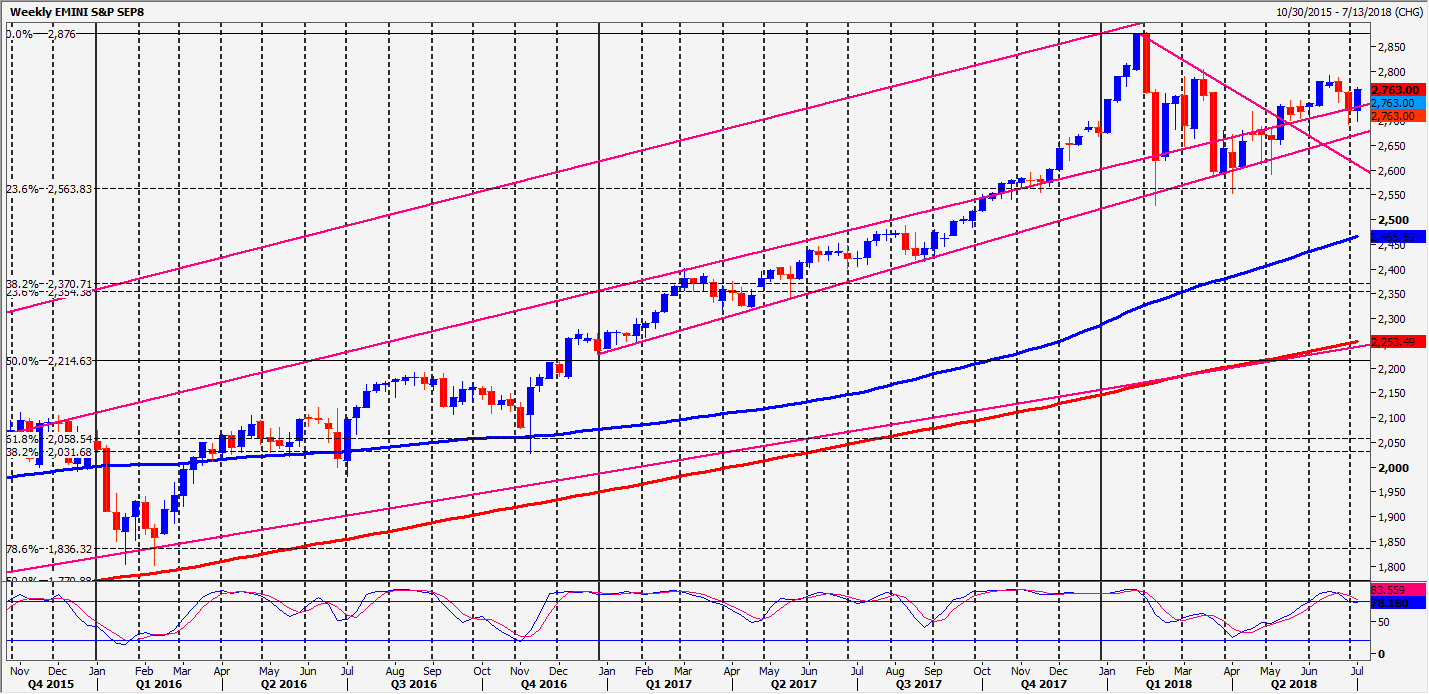
S&P September contract
Emini S&P key to direction is the 4 month trend line resistance at 2864/66. We are overbought on the weekly, daily & intraday charts. We are within 15 points of the all time high...which means a top here risks the formation of a huge double top sell signal. A weekly close below 2840 tonight would be a negative signal. If a double top were to form, this implies a drop of up to 700 points, or about 30%, to around the 200 week moving average.
Minor support at 2857/56 & 2853/52 (we bottomed exactly here over the past 2 days) but the best support for today at 2847/45. Below 2842 signals further losses therefore towards strong support at 2837/35. We should see a bounce from here.
Above 2870 tests the all time high at 2776. A weekly close above here on Friday is positive for next week of course.
Author

Jason Sen
DayTradeIdeas.co.uk


