We will look at the past performance of 1 hour Elliott Wave Charts of DAX index. In which, the rally from 28 January 2021 low unfolded as an impulse structure. And showed a higher high sequence with a bullish sequence stamp favored more upside extension to take place. Therefore, we advised members not to sell the index & buy the dips in 3, 7, or 11 swings at the blue box areas. We will explain the structure & forecast below:
DAX 1 Hour Elliott Wave chart
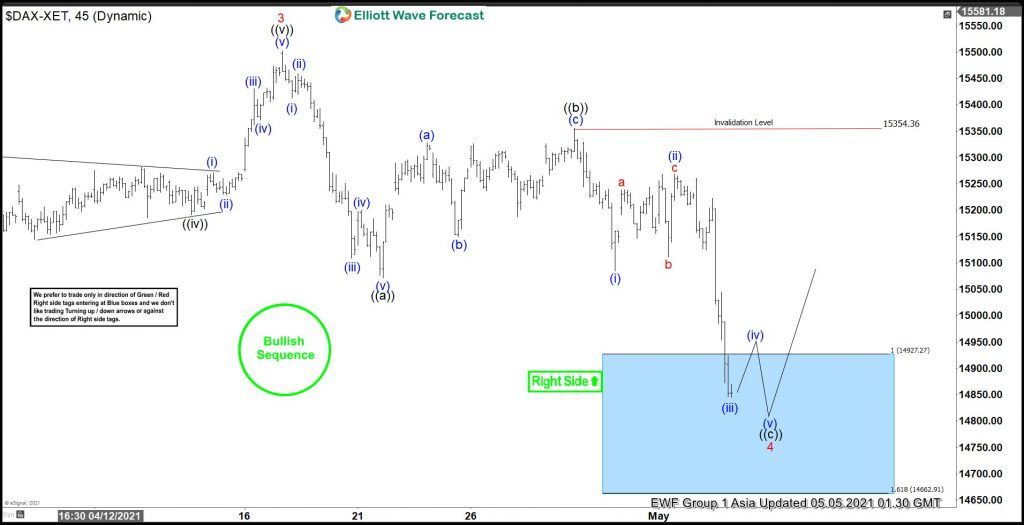
Below is the 1hr Elliott wave chart of DAX from the 5/05/2021 Asia update. In which, the rally to 15501.84 high ended the higher degree wave 3. Down from there, the index corrected lower within wave 4 pullback. The internals of that pullback unfolded as Elliott wave zigzag structure where the first leg of the pullback ended in wave ((a)) at 15071.78 low. While a 3 wave bounce ended wave ((b)) at 15355.28 high.
Then the index started the next leg lower of the pullback in wave ((c)). And managed to reach the blue box area at 14926.25- 14661.90 100%-161.8% Fibonacci extension area of ((a))-((b)). From there, buyers were expected to appear looking for further upside ideally or for a 3 wave bounce at least.
DAX 1 Hour Elliott Wave chart
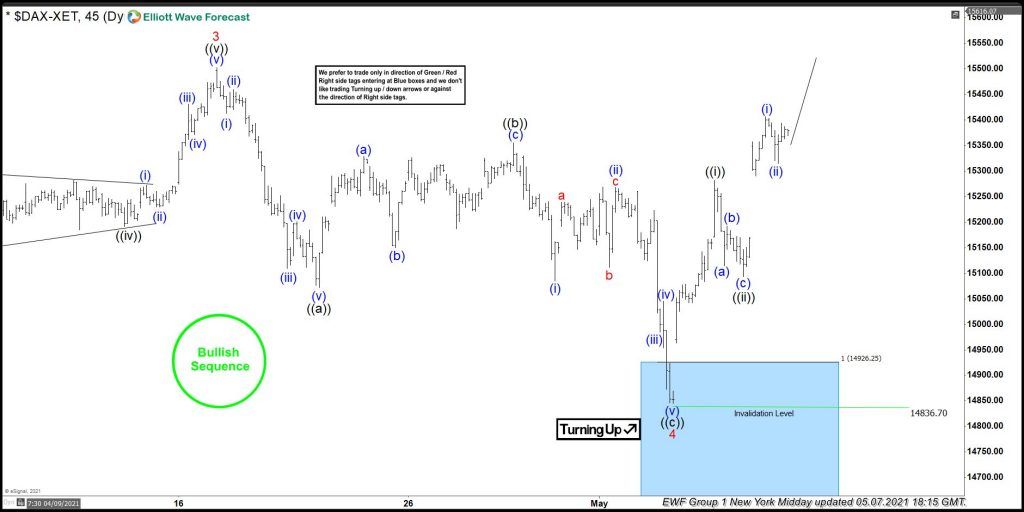
Here’s the 1hr Elliott wave chart of DAX from the 5/07/2021 Midday update. The index is showing a strong reaction higher taking place from the blue box area after ending the zigzag correction at 14836.70 low. Allowed members to create a risk-free position shortly after taking the long positions at the blue box area. However, a break above 15501.84 high still needs to be seen to confirm the next leg higher & avoid double correction lower.
FURTHER DISCLOSURES AND DISCLAIMER CONCERNING RISK, RESPONSIBILITY AND LIABILITY Trading in the Foreign Exchange market is a challenging opportunity where above average returns are available for educated and experienced investors who are willing to take above average risk. However, before deciding to participate in Foreign Exchange (FX) trading, you should carefully consider your investment objectives, level of xperience and risk appetite. Do not invest or trade capital you cannot afford to lose. EME PROCESSING AND CONSULTING, LLC, THEIR REPRESENTATIVES, AND ANYONE WORKING FOR OR WITHIN WWW.ELLIOTTWAVE- FORECAST.COM is not responsible for any loss from any form of distributed advice, signal, analysis, or content. Again, we fully DISCLOSE to the Subscriber base that the Service as a whole, the individual Parties, Representatives, or owners shall not be liable to any and all Subscribers for any losses or damages as a result of any action taken by the Subscriber from any trade idea or signal posted on the website(s) distributed through any form of social-media, email, the website, and/or any other electronic, written, verbal, or future form of communication . All analysis, trading signals, trading recommendations, all charts, communicated interpretations of the wave counts, and all content from any media form produced by www.Elliottwave-forecast.com and/or the Representatives are solely the opinions and best efforts of the respective author(s). In general Forex instruments are highly leveraged, and traders can lose some or all of their initial margin funds. All content provided by www.Elliottwave-forecast.com is expressed in good faith and is intended to help Subscribers succeed in the marketplace, but it is never guaranteed. There is no “holy grail” to trading or forecasting the market and we are wrong sometimes like everyone else. Please understand and accept the risk involved when making any trading and/or investment decision. UNDERSTAND that all the content we provide is protected through copyright of EME PROCESSING AND CONSULTING, LLC. It is illegal to disseminate in any form of communication any part or all of our proprietary information without specific authorization. UNDERSTAND that you also agree to not allow persons that are not PAID SUBSCRIBERS to view any of the content not released publicly. IF YOU ARE FOUND TO BE IN VIOLATION OF THESE RESTRICTIONS you or your firm (as the Subscriber) will be charged fully with no discount for one year subscription to our Premium Plus Plan at $1,799.88 for EACH person or firm who received any of our content illegally through the respected intermediary’s (Subscriber in violation of terms) channel(s) of communication.
Recommended Content
Editors’ Picks
USD/JPY flat-lines below 151.50 after soft Japanese CPI data
USD/JPY stays defensive below 151.50 after the release of a soft Japan's CPI report and mixed Industrial Production and Retail Sales data on Friday. Japanese verbal intervention also weighs on the pair amid the holiday-thinned conditions on Good Friday. US PCE inflation awaited.
AUD/USD buyers lack vigor above 0.6500 amid Good Friday trading lull
AUD/USD is trading listlessly above 0.6500 in the Asian session amid light trading on Good Friday. The Aussie pair shrugs off encouraging comments from China's FX regulator, as price action remains subdued ahead of the US PCE inflation data.
Gold flirts with record highs above $2,230, all eyes on US PCE data
Gold price flirts with record highs around $2,230 during the Asian session on Friday. The uptick of yellow metal is bolstered by the safe-haven flows amidst growing economic concerns and the prospect of interest rate cuts from the US Federal Reserve.
Ripple's move above this key level could trigger nearly 50% rally for XRP
Ripple price has overcome a critical resistance level and flipped into a support floor on the weekly time frame. This development happened while XRP tightly consolidated for roughly 250 days. As this coiling up comes undone, investors can expect XRP to kickstart a massive rally.
Will they won’t they cut rates is the question of Q2?
There has been some significant push back from Fed and Bank of England members around the timing of rate cuts, and the Bank of Japan still haven’t physically intervened in the FX market to stem yen weakness although they are threatening to do so.