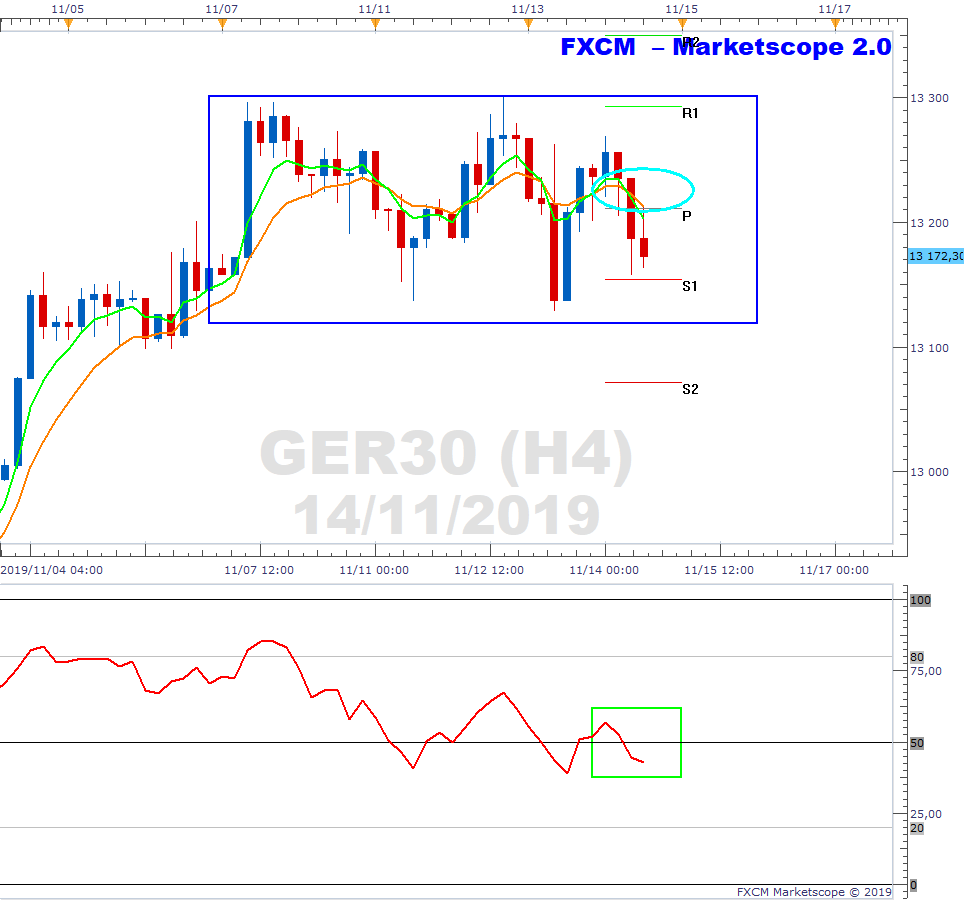
DAX Flashes Weakness on H4 Time
The below is the H4 chart of the GER30. The index has been range bound for this week as per the blue rectangle. However, we note that the green 5-period EMA has crossed below its orange 10-period EMA (aqua ellipse) and that the RSI has dropped to the bearish side of 50 (green rectangle). We are now looking to see if a trend catches i.e. if the EMAs develop angle and separation to the downside. If this does happen it may be indicative that the current congestion pattern has been distributive in nature. We continue to monitor.
Past performance is not an indicator of future results.
CHART SOURCE: FXCM MARKETSCOPE 2.0
Author

Russell Shor (MSTA, CFTe, MFTA) has an Honours Degree in Economics from the University of South Africa and holds the coveted Certified Financial Technician and Master of Financial Technical Analysis qualifications from the Interna


