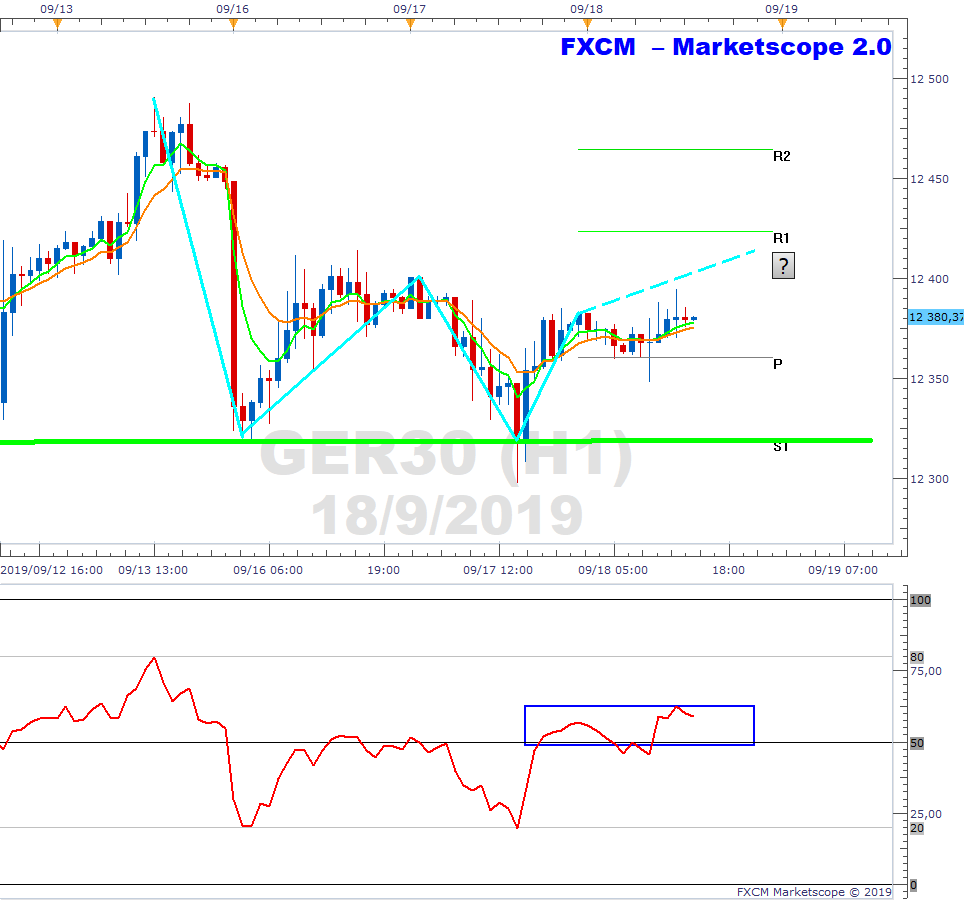
DAX Double Bottom on H1 Timeframe

The below is the hourly chart of the GER30. It seems as if a double bottom is potentially in place (aqua line studies). If this is the case, it may be signalling higher prices ahead. Price action held at central (P) support and has now started moving upwards. For the double bottom to play out and for price to head towards R1, we need to see further angle and separation in the EMAs. We continue to monitor.
Past performance is not an indicator of future results.
CHART SOURCE: FXCM MARKETSCOPE 2.0
Author

Russell Shor (MSTA, CFTe, MFTA) has an Honours Degree in Economics from the University of South Africa and holds the coveted Certified Financial Technician and Master of Financial Technical Analysis qualifications from the Interna
More from Russell Shor, CFTe, MFTA


