DAX 30 Bounce at 61.8% Indicates Bull Reversal?
The German DAX 30 index fell sharply in recent weeks after it broke below the support trend line (dotted blue) of the previous uptrend. A bullish bounce, however, seems to indicate that the bulls are back in control – let’s review the wave patterns.
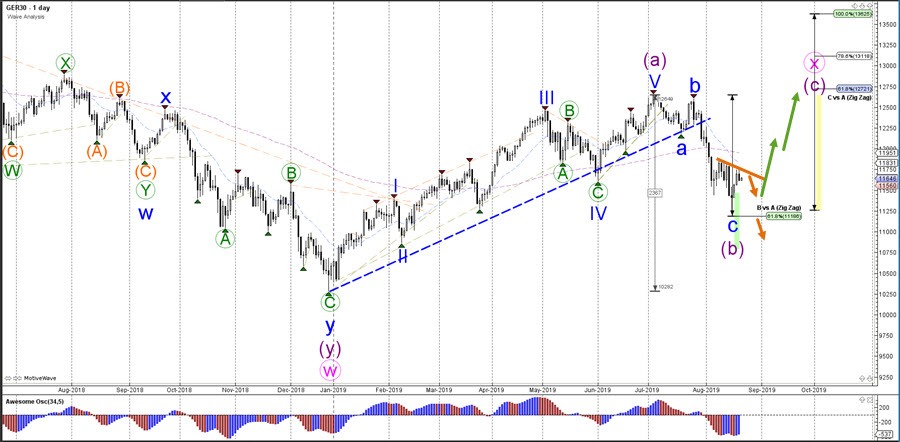
DAX 30
Daily
The DAX 30 seems to have made a bullish bounce at the 61.8% Fibonacci retracement level of potential wave B vs A, which could complete a larger wave B (purple) of an ABC (purple) zigzag correction. A break above the resistance trend line (orange) could confirm a new uptrend and could aim for the Fibonacci targets of wave C vs A. A break below the 61.8% Fib however could indicate more downside pressure.
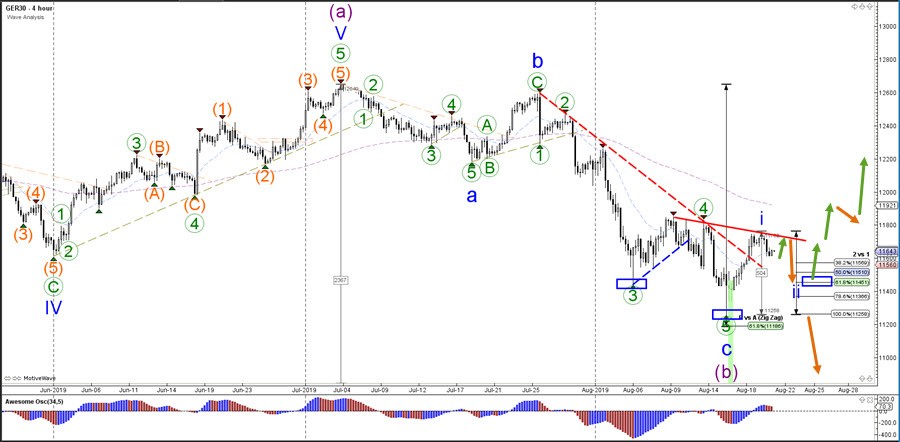
4 hour
The DAX 30 broke above the steep resistance trend line (dotted red), which could be a wave 1 (blue) of a new uptrend as long as price stays above the previous bottom and 100% Fibonacci retracement level. Bearish price action could just be a retracement and a potential inverted head and shoulders reversal chart (blue boxes) could take place if price makes a bounce in the blue box. The main criteria of confirmation however remains the break above the resistance trend line (red).
The analysis has been done with the CAMMACD.MTF template.
For more daily technical and wave analysis and updates, sign-up up to our ecs.LIVE channel.
Author

Chris Svorcik
Elite CurrenSea
Experience Chris Svorcik has co-founded Elite CurrenSea in 2014 together with Nenad Kerkez, aka Tarantula FX. Chris is a technical analyst, wave analyst, trader, writer, educator, webinar speaker, and seminar speaker of the financial markets.


