DAX 30 ABC pullback awaits critical breakout up or down
-
German stock index DAX 30 is building a bearish pullback to the 23.6% Fibonacci level after completing 5 bullish waves (grey) in a wave 3 (pink).
-
Price action, however, is in between the 21 ema high and 21 ema low after bouncing at the 23.6% Fibonacci level. This is an indecision zone.
-
The next breakout is critical. A bullish breakout (green arrows) above the resistance (orange) could indicate an uptrend continuation.

Will there be a deeper wave 4 retracements to the 38.2% Fibonacci level or will price break above the 21 ema high? Let’s review.
Price charts and technical analysis
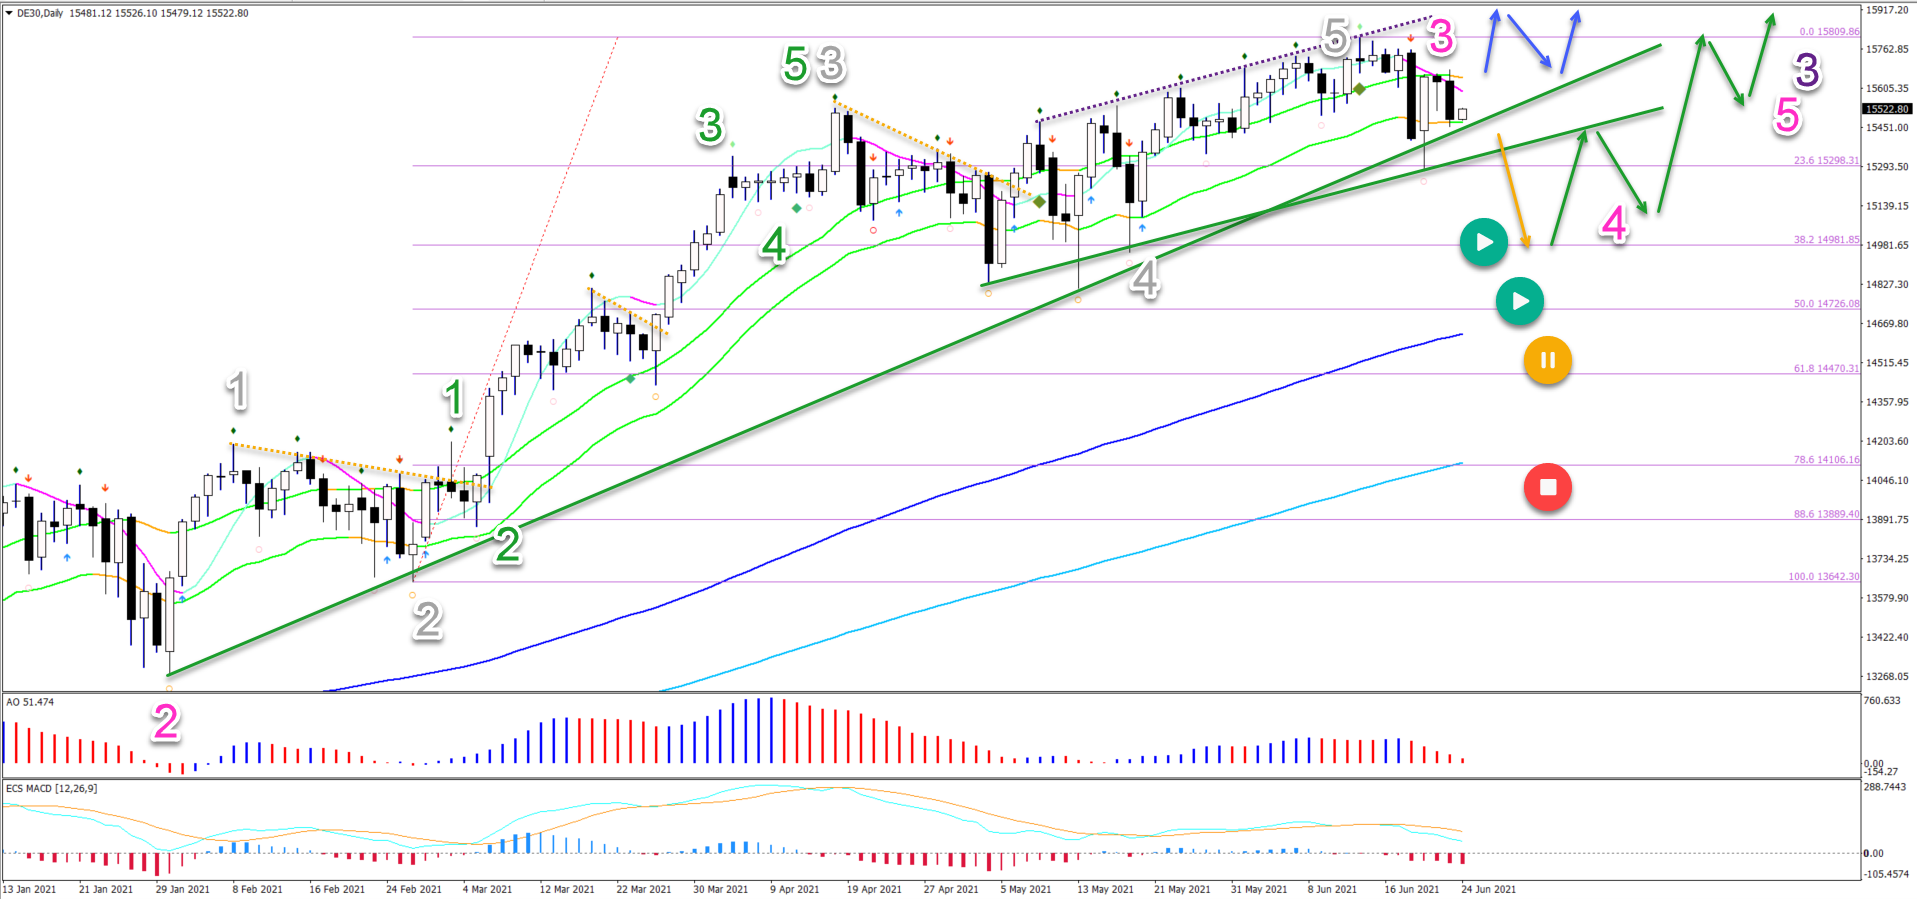
The DAX 30 daily chart remains very bullish with the 21 emas above the 144 ema and 233 ema. There is also lots of space between the moving averages, which indicates a strong trend.
-
Price action, however, is in between the 21 ema high and 21 ema low after bouncing at the 23.6% Fibonacci level. This is an indecision zone.
-
Price action has completed a wave 3 (pink).
-
The current pullback is probably a wave 4 (pink).
-
A bullish breakout (blue arrows) could also take place above the 21 ema high.
-
A bearish break (orange arrow) below the support trend lines (green) could indicate a deeper wave 4. The main target is the 38.2% Fibonacci level.
-
A bullish bounce (green arrows) at 38.2% or 50% Fibonacci is expected.
-
A break below the 50% Fibonacci level places the Elliott Wave outlook on hold (orange) whereas a deeper retracement invalidates it (red).
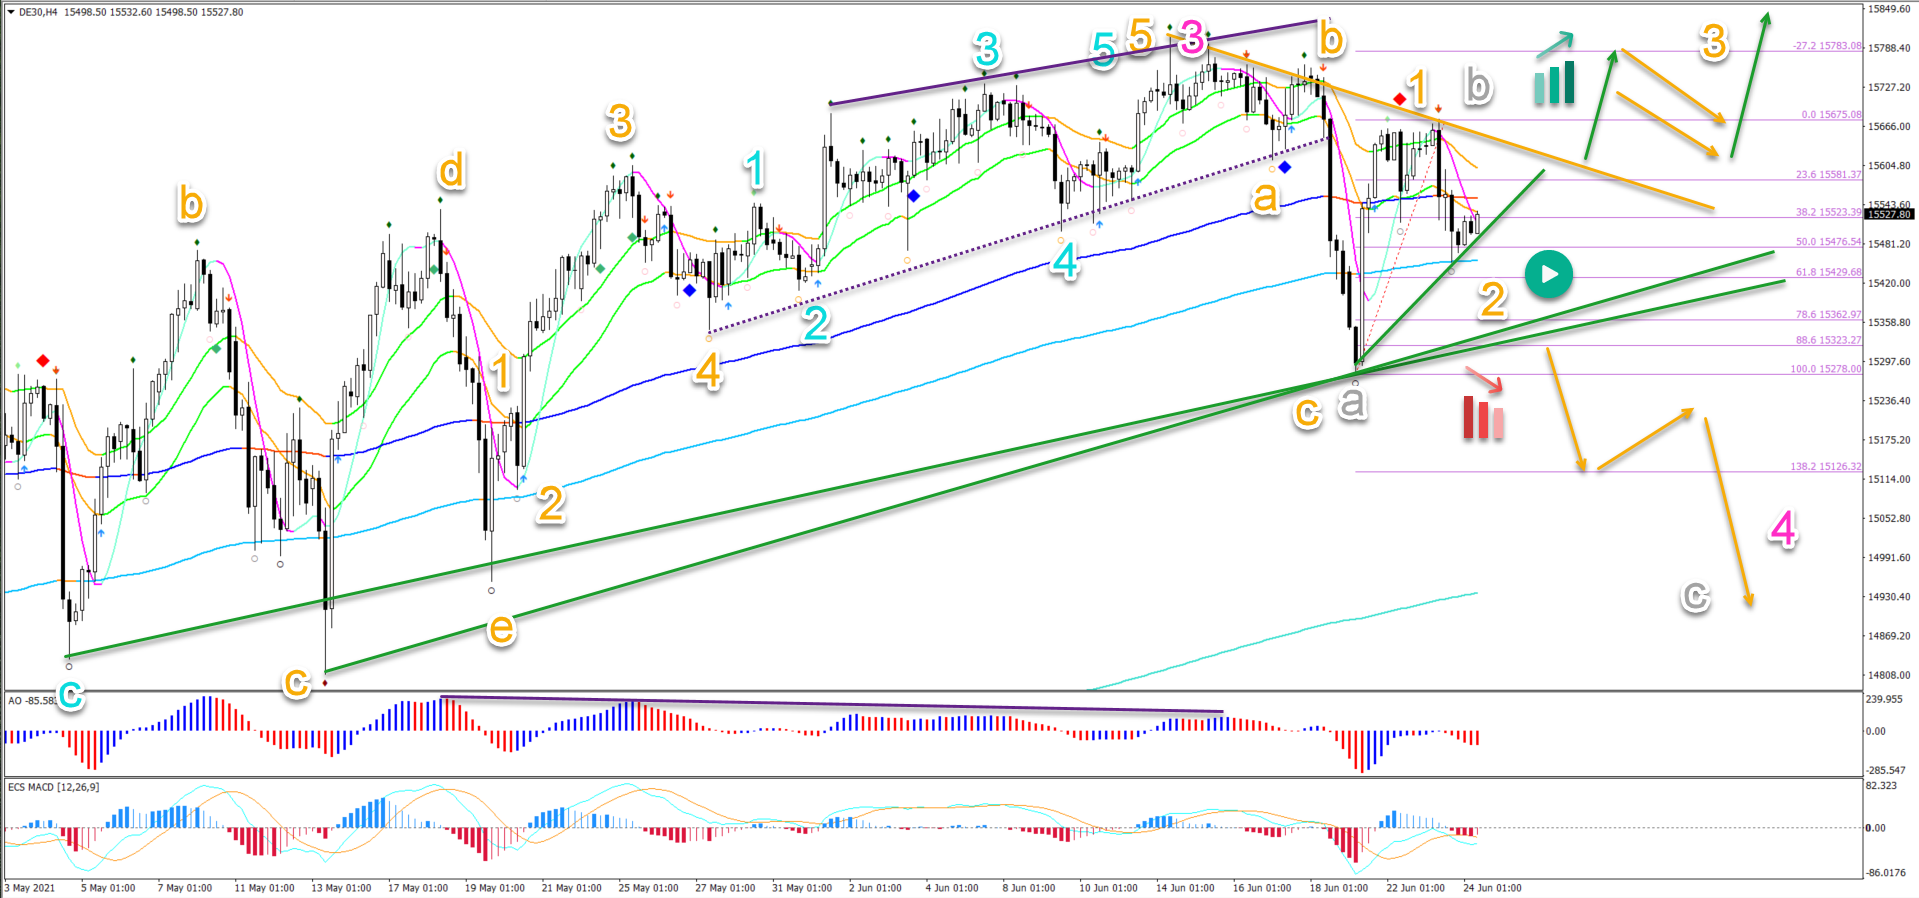
On the 4 hour chart, we can see that price action completed a 5 wave (blue) ending diagonal pattern in wave 5 (orange):
-
After the divergence pattern appeared (purple line), price action made a bearish ABC (orange) pullback.
-
The next breakout is critical. A bullish breakout (green arrows) above the resistance (orange) could indicate an uptrend continuation.
-
A bearish breakout (orange arrows) below the support trend lines (green) could indicate a deeper retracement.
-
A bullish breakout means that price is making a wave 123 (orange) up.
-
A bearish breakout means that price is building a bearish ABC (grey) pattern down.
The analysis has been done with the ecs.SWAT method and ebook.
Author

Chris Svorcik
Elite CurrenSea
Experience Chris Svorcik has co-founded Elite CurrenSea in 2014 together with Nenad Kerkez, aka Tarantula FX. Chris is a technical analyst, wave analyst, trader, writer, educator, webinar speaker, and seminar speaker of the financial markets.


