Daily Technical & Trading Outlook EUR/USD


Last Update At 27 Sep 2016 00:08GMT
Trend Daily Chart
Sideways
Daily Indicators
Neutral
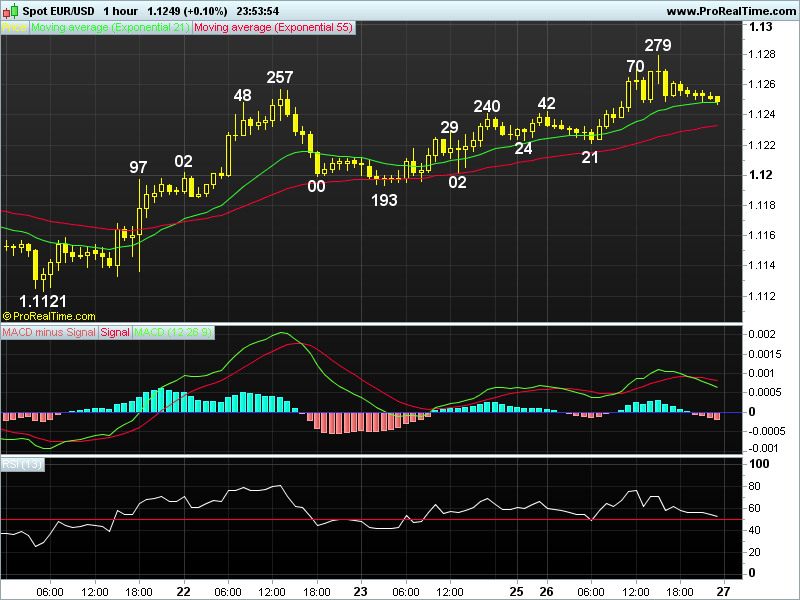
21 HR EMA
1.1248
55 HR EMA
1.1233
Trend Hourly Chart
Up
Hourly Indicators
Bearish divergences
13 HR RSI
52
14 HR DMI
+ve
Daily Analysis
Consolidation b4 one more rise
Resistance
1.1366
1.1327 - Sep's high (08)
1.1279 - Y'day's high
Support
1.1221 - Y'day's low
1.1193 - Last Fri's low
1.1149 - Sep 16 low
-
EUR/USD - 1.1250... Although euro retreated in Asia y'day after initial gain to 1.1242, renewed buying at 1.1221 lifted price, release of upbeat German Ifo sent price abv last week's 1.1257 high to 1.1279 in NY b4 retreating.
-
Looking at the daily chart, euro's erratic rise fm Jun's 3-month bottom at 1.0912 to 1.1366 in Aug confirms MT decline fm 2016 peak at 1.1617 (May) has ended there, however, the strg retreat to 1.1123 n then subsequent choppy side- ways swings suggest broad consolidation would continue. Having said, last week's rally fm 1.1121 to 1.1257 signals upside bias remains for gain to 1.1327 (Sep top), a daily close abv there would encourage for re-test of 1.1366 but break there needed to extend said MT rise fm 1.0912 to 1.1432 (Jun's high). On the downside, only below 1.1121 sup would risk stronger retracement to 1.1085 (61.8 % r), then 1.1046 b4 prospect of another rise in early Oct.
-
Today, despite euro's retreat fm 1.1279, as long as Fri's low at 1.1193 holds, outlook remains mildly bullish for last Wed's 5-week trough at 1.1121 to resume, abv 1.1284/85 would extend to 1.1300/10, as hourly indicators have dis- played 'bearish divergences', reckon 1.1327 (Sep's high) would cap upside.
Author

AceTrader Team
AceTrader
Led by world-renowned technical analyst Wilson Leung, we have a team of 7 analysts monitoring the market and updating our recommendations and commentaries 24 hours a day.


