Daily Technical Outlook on Major - USD/JPY


Last Update At 17 Apr 2019 00:01GMT
Trend Daily Chart
Sideways
Daily Indicators
Rising
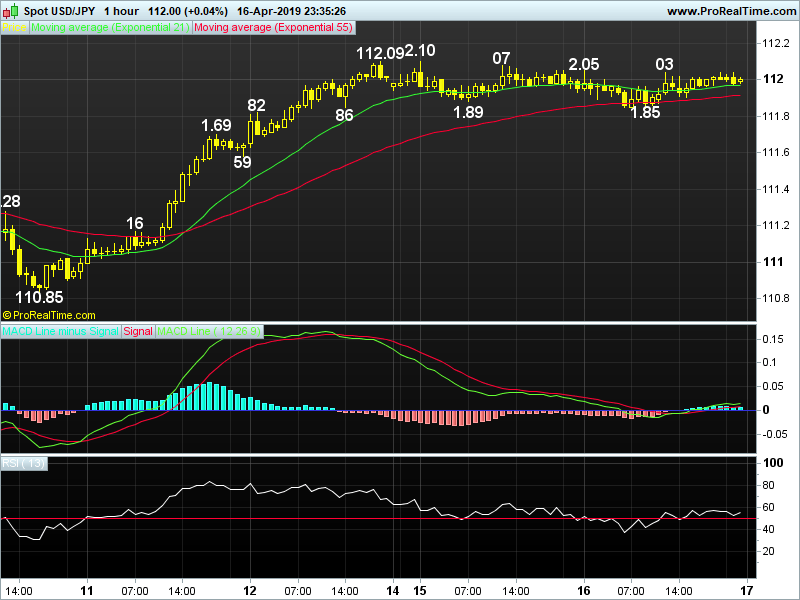
21 HR EMA
111.97
55 HR EMA
111.91
Trend Hourly Chart
Up
Hourly Indicators
Neutral
13 HR RSI
55
14 HR DMI
+ve
Daily Analysis
Consolidation b4 one more rise
Resistance
112.96 - 100% proj. of 109.71-111.82 fm 110.85
112.67 -Dec 19 2018 high
112.14 - Mar 10-week high (5th)
Support
111.82 - Prev. Apr's high (now sup)
111.58 - Last Tue's high (now sup)
111.28 - Last Wed's high (now sup)
-
USD/JPY - 111.99.. Despite hitting a 4-week high of 112.10 on Mon, dlr remained on the back foot in Asia n European morning y'day on cross unwinding in yen b4 rebounding to 112.03 in NY morning, however, price later moved narrowly.
-
On the bigger picture, dlr's fall fm 118.66 (Dec 2016) to 107.32 in 2017 (Sep) confirms uptrend fm 2016 29-month bottom at 99.00 has made a top. Despite a strg rise fm 2018 16-month bottom at 104.57 to 114.55 in Oct, subsequent flash crash to a 9-month low at 104.79 in early Jan suggests correction over. However, dlr's erratic rise to 112.14 in early Mar indicates choppy trading abv 104.57 would continue. As dlr has risen after retreat to 109.71 (Mar low), re-test of 112.14 would be forthcoming next, abv would extend said upmove fm 104.79 to 113. 38 (50% proj. of 104.79-112.14 projected fm 109.71), 'bearish divergences' on the daily indicators should cap price at 114.25 (61.8% proj.).
-
Today, dlr's rebound fm 111.85 to 112.03 suggests pullback fm 112.10 has possibly ended n abv said res extend recent upmove to 112.55 after initial conso- dation, prominent 'bearish divergences' on hourly indicators should cap price below 112.67. Only below 111.58 risks stronger retracement to 111.28.
Author

AceTrader Team
AceTrader
Led by world-renowned technical analyst Wilson Leung, we have a team of 7 analysts monitoring the market and updating our recommendations and commentaries 24 hours a day.


