Daily Technical Outlook on Major - USD/CHF


Last Update At 18 Jan 2018 01:33GMT
Trend Daily Chart
Sideways
Daily Indicators
Falling
21 HR EMA
0.9631
55 HR EMA
0.9636
Trend Hourly Chart
Down
Hourly Indicators
Rising
13 HR RSI
54
14 HR DMI
+ve
Daily Analysis
Initial rise b4 retreat
Resistance
0.9732 - Last Thur's low (now res)
0.9700 - Prev. Jan's low (now res)
0.9685 - This week's high (Mon)
Support
0.9603 - Mon's low
0.9573 - Y'day's near 4-month low
0.9553 - Jun 2017 low
-
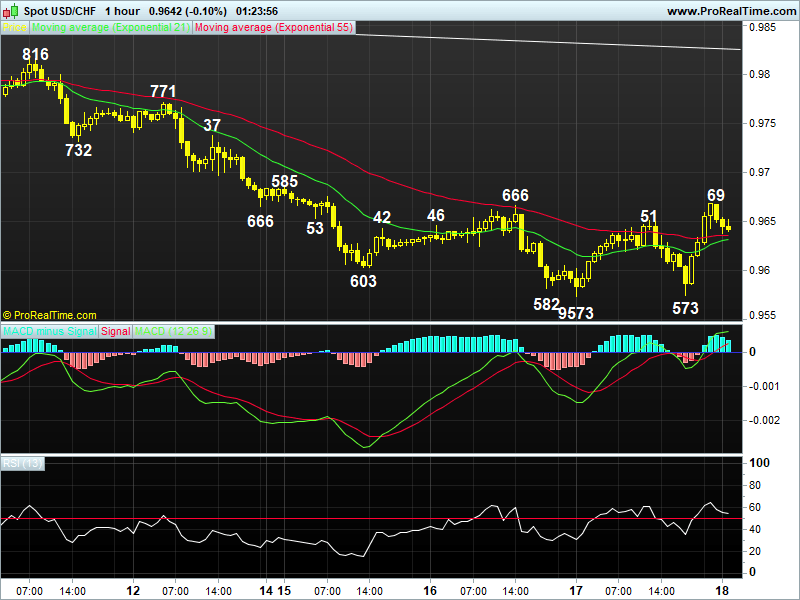
USD/CHF - 0.9642.. Despite continuing its recent losing streak n hitting a near 4-month low of 0.9573 at Asian open, dlr rebounded to 0.9651 b4 re-testing 10.9573, rally in U.S. stocks later sent price to session highs of 0.9659.
-
On the bigger picture 1st, despite dlr's resumption of downtrend fm 2016 6-year peak at 1.0344 (Dec) to a fresh 2-year bottom of 0.9421 in Sep, subse- quent rally abv Aug's 0.9773 high to a 5-month peak at 1.0038 in Oct confirms aforesaid decline fm 1.0344 has made a low there. Having said that, dlr's fall to 0.9700 initially in Jan n last Fri's break of this sup signals upmove fm 0.9421 has made a top n would head twds 0.9421 later this month or Feb. Therefore, selling dlr again on recovery is the way to go n only a daily close only abv 0.9700 (pre. Jan's low, now res) would signal temporary bottom is made n may risk stronger retracement twds 0.9771.
-
Today, dlr's rally fm 0.9573 to 0.9659 in NY on Wed, then 0.9669 in Aust. suggests recent decline has made a temp. low there as this lvl was accompanied by 'bullish convergences' on the hourly indicators, as long as 0.9603 is seen but only abv 0.9700 yields 0.9732/37.
Author

AceTrader Team
AceTrader
Led by world-renowned technical analyst Wilson Leung, we have a team of 7 analysts monitoring the market and updating our recommendations and commentaries 24 hours a day.


