Daily Technical Outlook on Major - USD/CHF


Last Update At 08 Dec 2017 00:53GMT
Trend Daily Chart
Sideways
Daily Indicators
Neutral
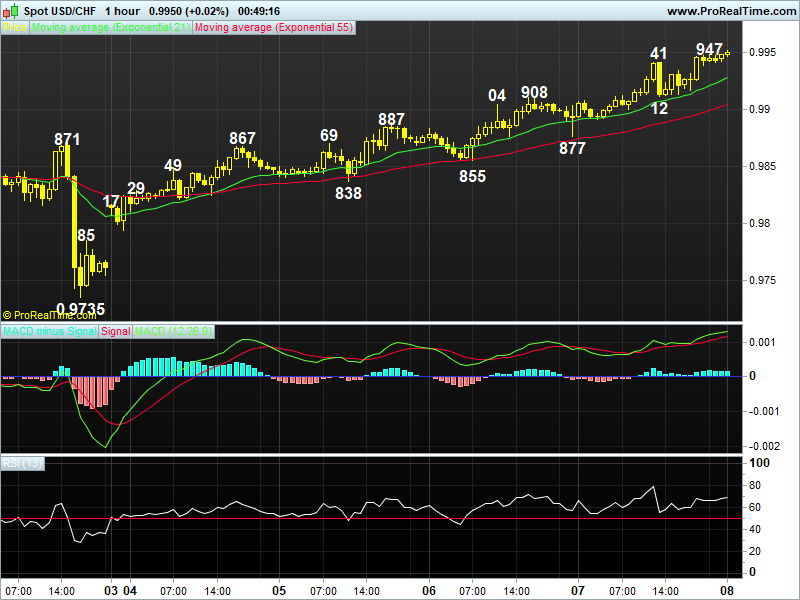
21 HR EMA
0.9927
55 HR EMA
0.9904
Trend Hourly Chart
Near term up
Hourly Indicators
Overbought
13 HR RSI
68
14 HR DMI
+ve
Daily Analysis
Consolidation b4 one more rise
Resistance
1.0088 - 50% proj. of 0.9421-1.0038 fm 0.9779
1.0038 - Oct high (27th)
0.9987 - Nov 13 high
Support
0.9908 - Wed's high
0.9877 - Wed's NY low
0.9838 - Tue's low
-
USD/CHF - 0.9949.. Dlr continued this week's winning streak on Thur. Des pite initial brief drop to 0.9877 (AUS), buying interest quickly emerged n pushed price to 0.9941 in NY morning, then later to session highs of 0.9947.
-
Looking at the bigger picture, despite dlr's resumption of its downtrend fm 2016 6-year peak at 1.0344 (Dec) to a fresh 2-year trough of 0.9421 in Sep, subsequent rally abv Aug's 0.9773 high to a 4-month peak at 0.9837 in early Oct n then rise to a fresh 5-month peak at 1.0038 in Oct confirms aforesaid fall fm 1.0344 has made a low there. However, dlr's weakness to 0.9735 last Fri signals said upmove fm 0.9421 has made a top n downside bias remains for weakness to 0.9657, being a 'dynamic' 61.8% r of aforesaid move but reckon 0.9602 (70.7% r) should hold on 1st testing n yield rebound. On the upside, only a daily close abv 0.9987 suggests correction is possibly over n risks gain twds 1.0038.
-
Today, as current price is trading abv 21-hr n 55-hr emas, suggesting intra-day upside bias remains for gain twd next chart obj. at 0.9987, as hourly oscillators' reading are in o/bot territory, reckon 1.0038 should hold. Below 0.9908/12 sup area signals temp. top is made n yields 0.9877, break, 0.9838.
Author

AceTrader Team
AceTrader
Led by world-renowned technical analyst Wilson Leung, we have a team of 7 analysts monitoring the market and updating our recommendations and commentaries 24 hours a day.


