Daily Technical Outlook on Major -EUR/USD


Last Update At 19 Jan 2018 00:13GMT
Trend Daily Chart
Up
Daily Indicators
Rising
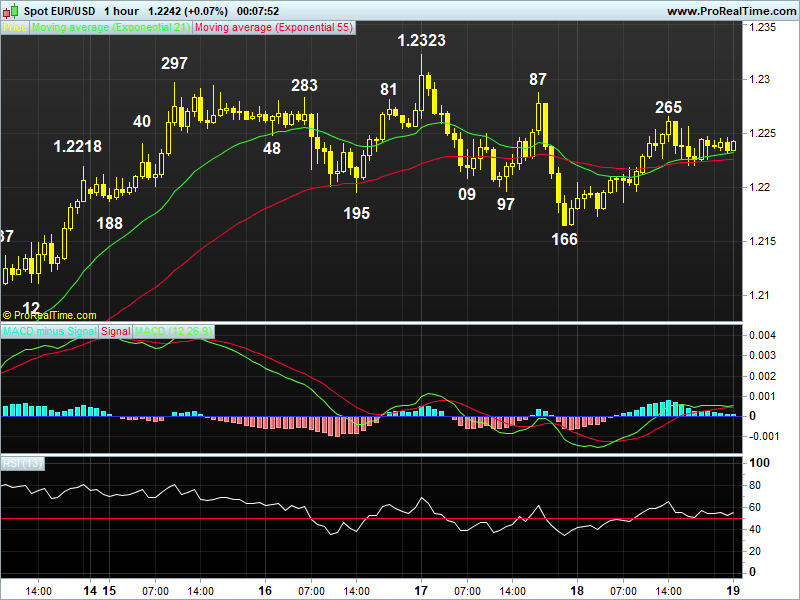
21 HR EMA
1.2232
55 HR EMA
1.2226
Trend Hourly Chart
Sideways
Hourly Indicators
Neutral
13 HR RSI
55
14 HR DMI
+ve
Daily Analysis
Consoldiation with upside bias
Resistance
1.2369 - 50% proj. of 1.1916-1.2323 fm 1.2166
1.2323 - Y'day's fresh 3-month high
1.2287 - Wed's NY high
Support
1.2218 - Y'day's European morning high (now sup)
1.2166 - Y'day's low (AUS)
1.2112 - Last Fri's NY low
. EUR/USD - 1.2242.. Trading the euro proved to be tricky this week as price continued to swing wildly, a potential sign of an imminent top formation. Despite extending Weds' fall to 1.2166 (AUS), price later rose to 1.2265 in NY.
. Looking at the bigger picture, despite euro's 4-month long wild swings following resumption of MT upmove fm 2017 Jan's near 14-year low at 1.0341 to a 2-1/2 year peak of 1.2093 in Sep, last Fri's impressive rally abv said major res on news of a success in German coalition talks confirms abovementioned uptrend has finally resumed n price is en route to 1.2345 after consolidation, however, reckon 1.2495 should cap upside, being 50% n 61.8% projection respectively of the rise fm 1.0341-1.2093 measured fm 1.1554. Current rising daily indicators add credence to this view. On the downside, only a weekly below 1.2093 (prev. high, now sup) signals temp. top is made n risks correction twds 1.1916 in Feb.
. Today, euro's strg rise fm 1.2166 to 1.2265 suggests pullback fm 1.2323 has ended n consolidation with upside bias remains for re-test of this temp. top , abv would extend recent uptrend to 1.2345/50, 'bearish divergences' on hourly indicators should cap price at 1.2365/70. Only below 1.2195 risks 1.2166, 1.2112.
Interested in EURUSD technicals? Check out the key levels
Author

AceTrader Team
AceTrader
Led by world-renowned technical analyst Wilson Leung, we have a team of 7 analysts monitoring the market and updating our recommendations and commentaries 24 hours a day.
More from AceTrader Team


