Daily technical and trading outlook – USD/CHF
 DAILY USD/CHF TECHNICAL OUTLOOK

Last Update At 14 Jan 2021 00:44GMT
Trend Daily Chart
Sideways
Daily Indicators
Turning up
21 HR EMA
0.8875
55 HR EMA
0.8876
Trend Hourly Chart
Sideways
Hourly Indicators
Turning up
13 HR RSI
46
14 HR DMI
-ve
Daily Analysis
Consolidation with upside bias
Resistance
0.8946 - Dec 07 high
0.8920 - Mon's high
0.8889 - Wed's high
Support
0.8850 - Wed's low
0.8821 - Last Wed's high (now sup)
0.8775 - Last Thur's low
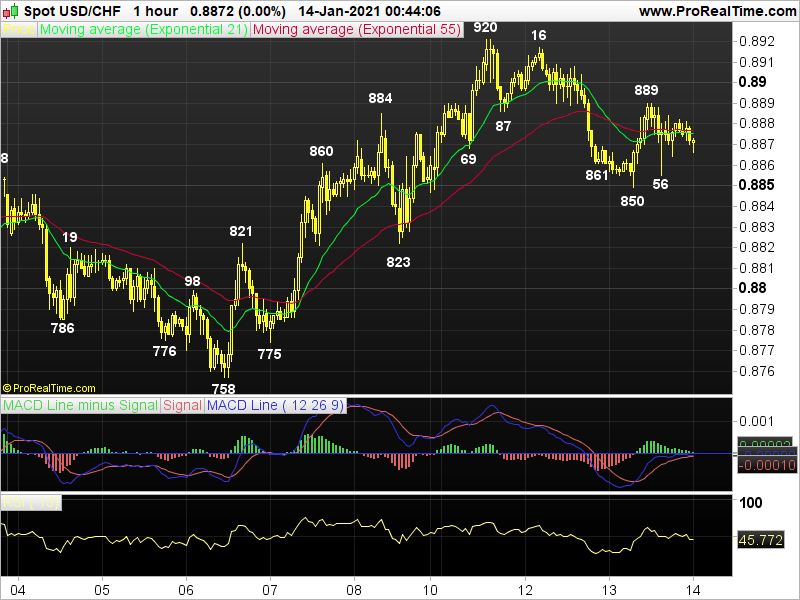
USD/CHF - 0.8879.. Although dlr extended decline fm Tue n fell to 0.8850 at European open, price found renewed buying n rose to 0.8889 on usd's strength b4 retreating to 0.8856 on selling in eur/chf cross.
On the bigger picture, despite dlr's rally fm Sep's bottom at 0.8999 to 0.9296 in late Sep, subsequent erratic fall to 0.9031 n Nov's brief break of 0.8999 to a fresh 5-1/2 year 0.8983 low due to usd's broad-based weakness signals LT downtrend fm 2016 peak at 1.0344 has once again resumed. Although dlr staged a rally to 0.9192 in Nov due to strg rise in U.S. yields, subsequent fall n then break of said Nov's bottom to 0.8758 last week signals price is en route to 0.8718, 'bullish convergences' on daily indicators may keep price abv 0.8646/ 56 n yield a correction. On the upside, a daily close abv 0.8983 signals low is made n risks stronger retracement twd 0.9093, then 0.9192.
Today, despite dlr's retreat fm Mon's near 5-week high at 0.8920 to 0.8850 y'day, subsequent rebound to 0.8889 suggests pullback has possibly ended n consolidation with upside bias remains for gain to 0.8946, anticipated bearish divergences should cap price below 0.8983. Below 0.8848/50 risks 0.8821/23.
Author

AceTrader Team
AceTrader
Led by world-renowned technical analyst Wilson Leung, we have a team of 7 analysts monitoring the market and updating our recommendations and commentaries 24 hours a day.


