Cycles and Financial Astrology

SP500
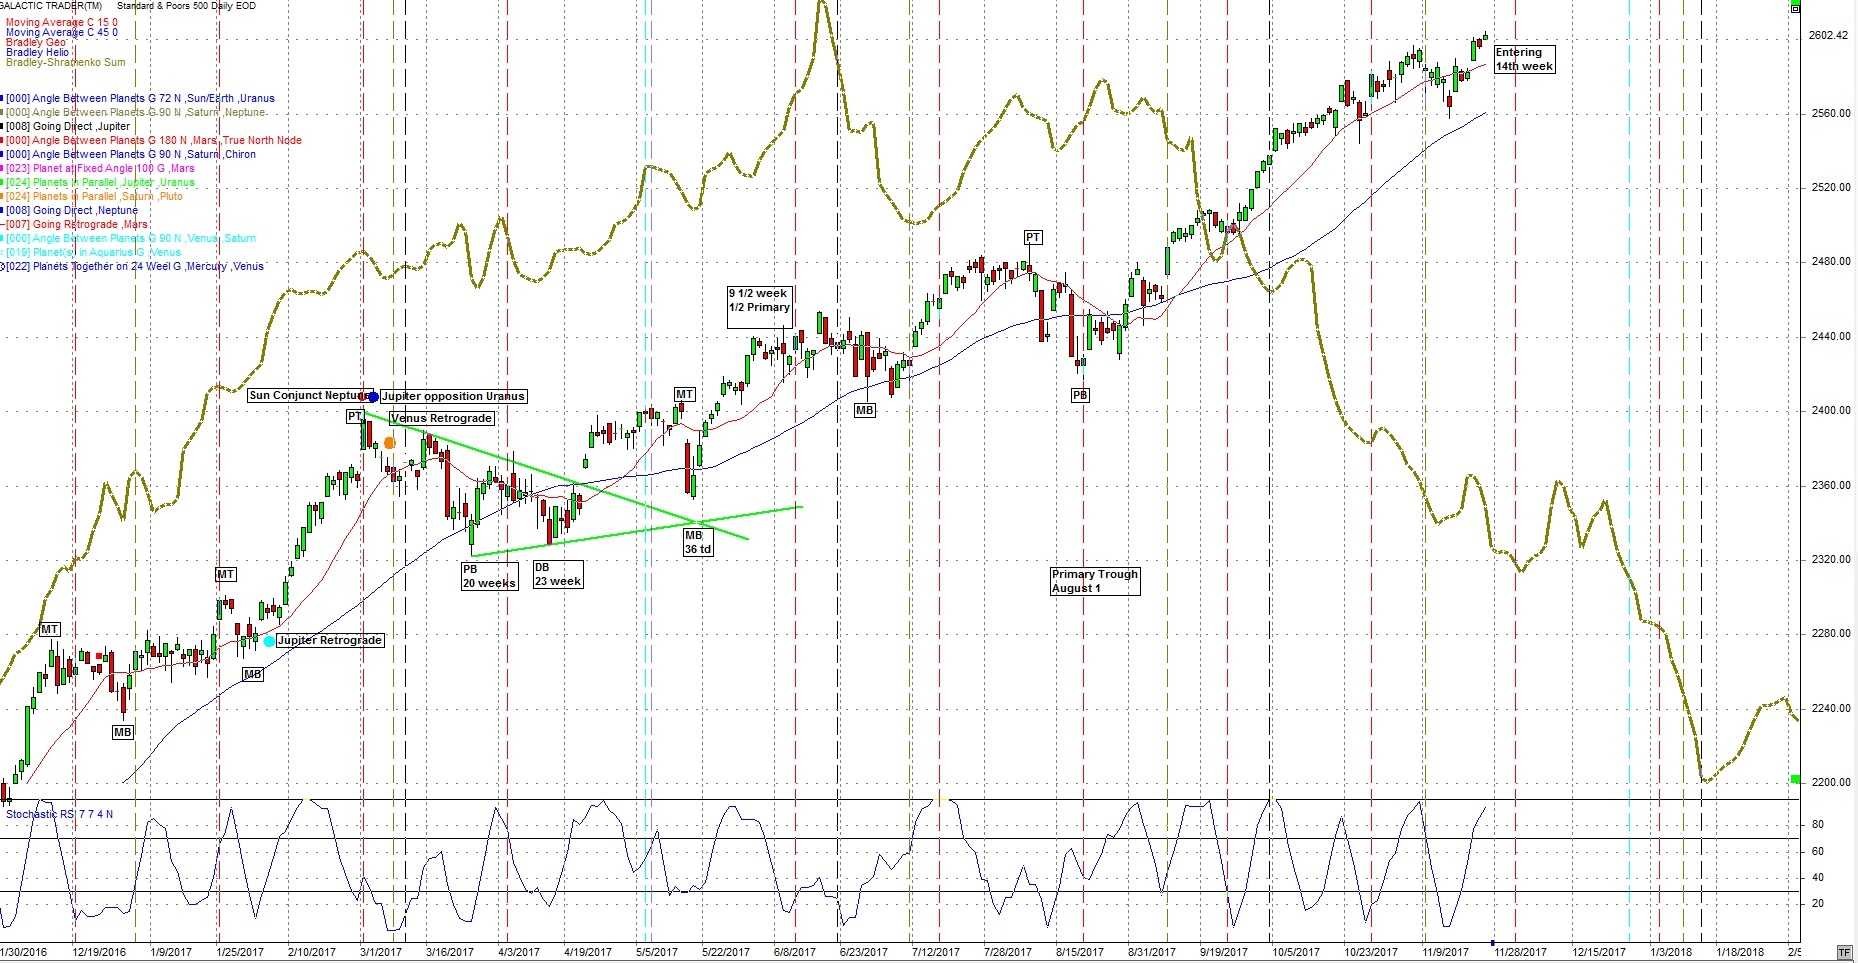
The last Primary cycle low was August 21st, the day of the Total Solar Eclipse.
We are now starting the 14th week of the SP500 primary cycle which has a range from 15 to 23 weeks. This has been an unusual time with the general market indices seemingly unstoppable. Price has touched the 15-day sma for one the few times in months. Whether it is central bank money, corporate buy-backs or money from some other source we need to know the time periods where a correction is more probable. We look at Cycles and Astro events that have a history of being 65% - 72 % correct. We will continue with this approach.
Note this last Primary cycle low on August 21 was not very deep. Price was below the 15 and 45 day sma and the 15 day dipped just below the 45 day sma.
The following daily chart of the SP500 shows the adjusted Bradley indicator (thick green line). It indicates a possible, I emphasize possible, change in trend near Nov 27 and Dec 4. The current daily closing high was November 8th at 2599.
November 24 / 25 is also a Martin Armstrong turn date. Look for surprise events. The Martin Armstrong turn dates are based on his Economic Confidence model. It is defining turns for the world economy although they often show up as turns in the markets.
We should stay aware the trends in the major US indices remain up and that is the way they should be played.
Astrology wise, early next week should be somewhat quieter until Friday Dec. 1 when we have a Perigee Full Moon, Mars in opposition to Uranus and Venus entering Sagittarius. On
Dec 2 Jupiter trines Neptune. On Dec 3 Mercury turns retrograde and the Sun squares Neptune. The latter two aspects have a history of changes in trend as does Jupiter trine Neptune.
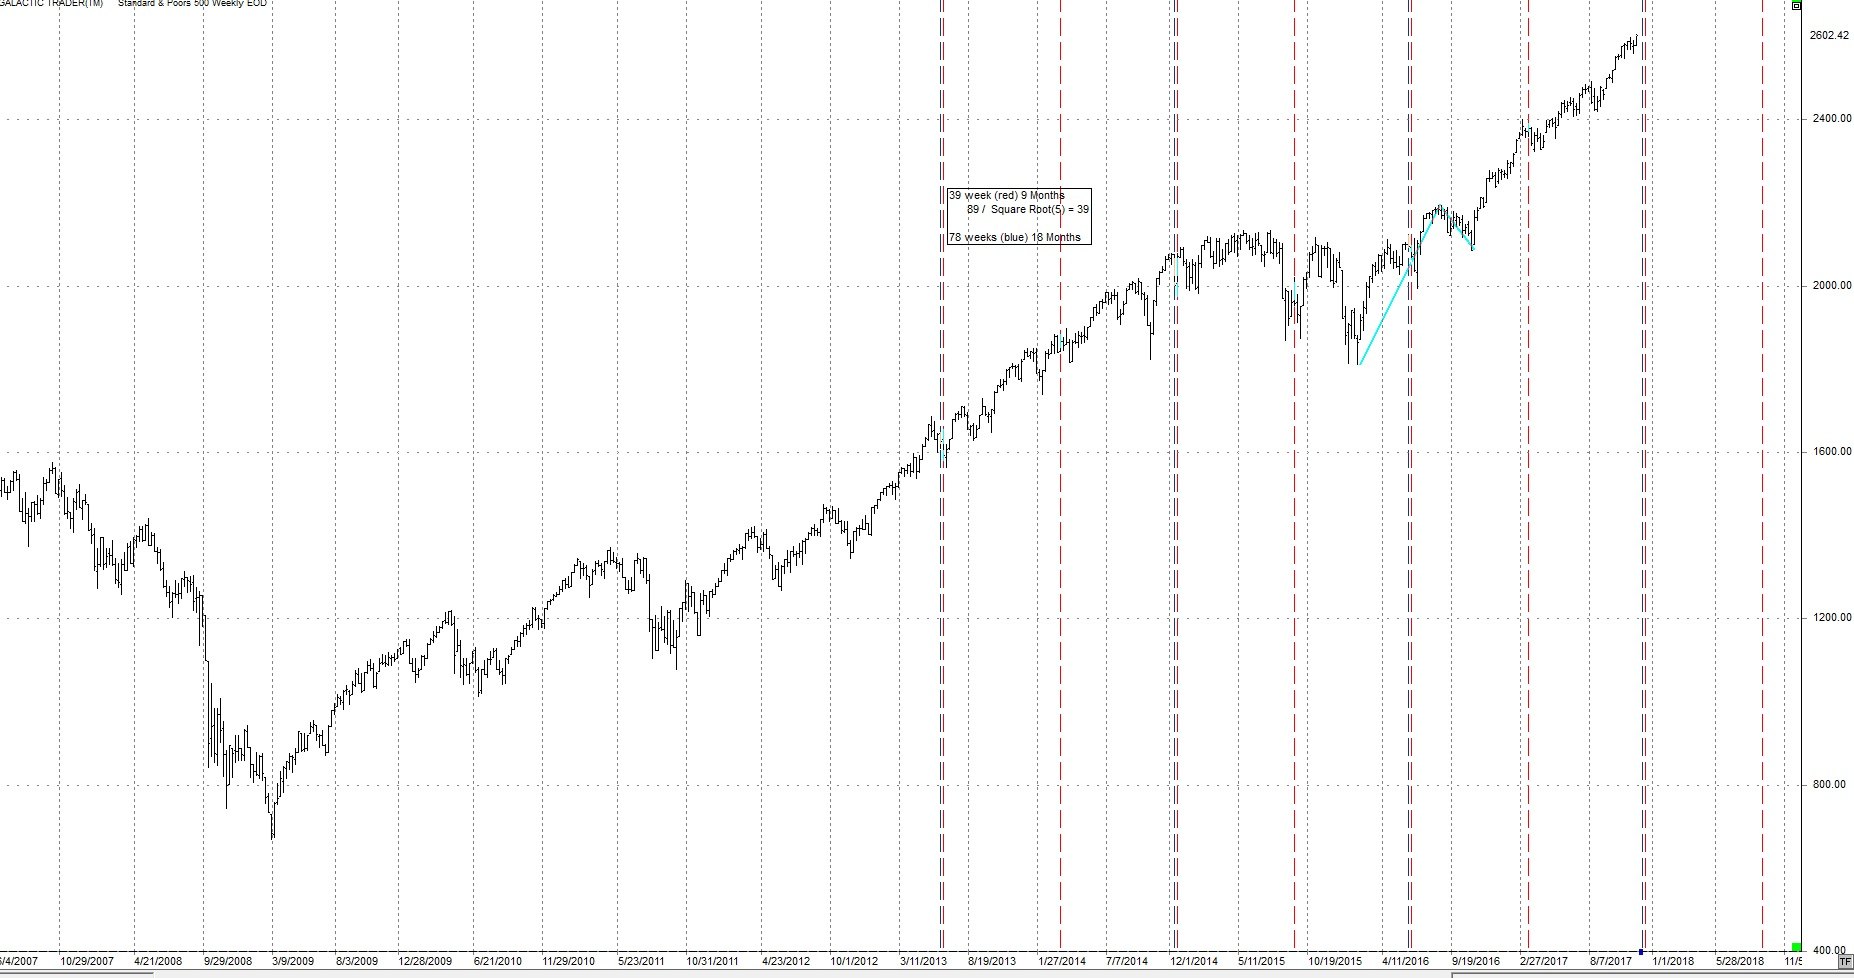
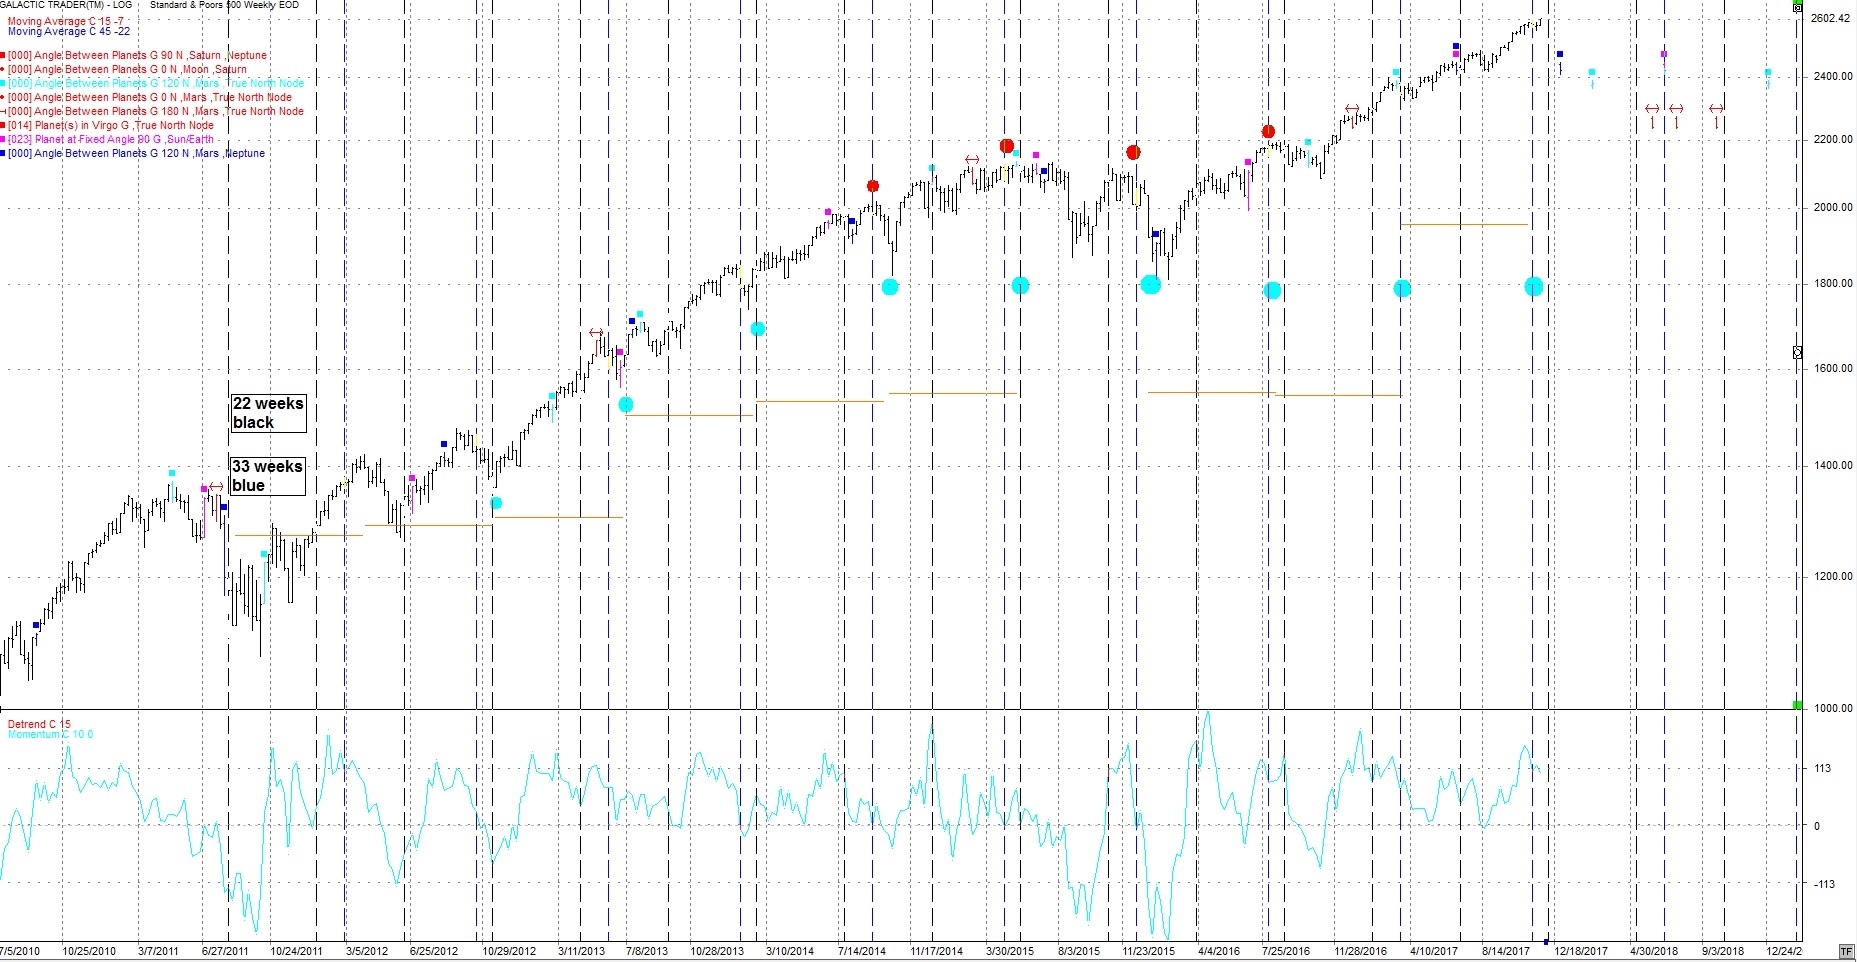
There is a longer term Market cycle coming due. That is the 9 / 18 month cycle as seen on the following weekly chart. I’m looking for the markets to start a move down by Dec. 6th. Subscribers look for the Mystery Cycle.
For the Astrologers in the group Dec 6th also has the Sun conjunct the heliocentric nodes of Uranus.
Also of note on the Winter Solstice, Dec 21st, when the Sun enters Capricorn, Saturn will conjunct the Sun and move into Capricorn as well. Saturn is in it’s rulership in Capricorn. This could be a difficult period.
The above combination could be defining problems / restrictions for the general population, particularly the mature population and with the Sun could affect the President or other leaders. This combination could affect a number of years in the future as Saturn is in a sign for approx.. 2 ½ years. Other conditions this may highlight are State funerals, public sorrow and disappointment in general. State assets could be affected as well as industries connected to metals and mining.
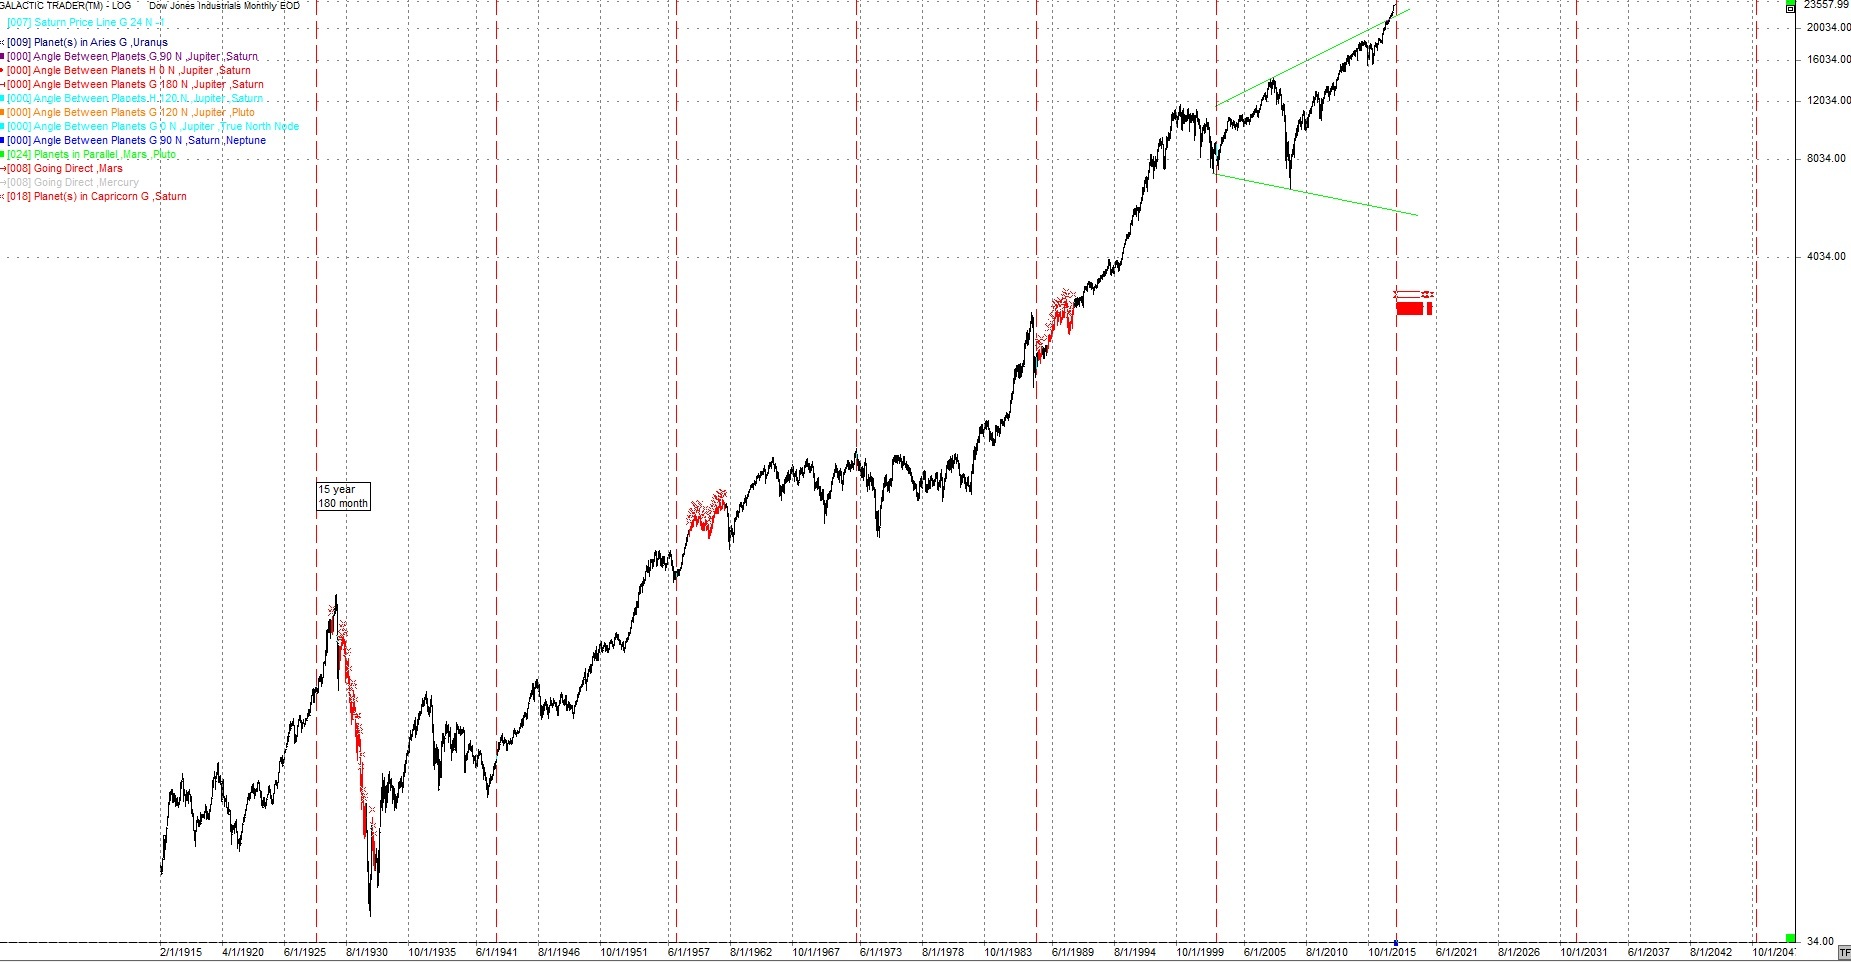
The following monthly chart of the DJIA shows when Saturn has been in Capricorn (red x’s). Notice they have all had significant drops. This chart also has the 15 year cycle which will be coming due in 2018.
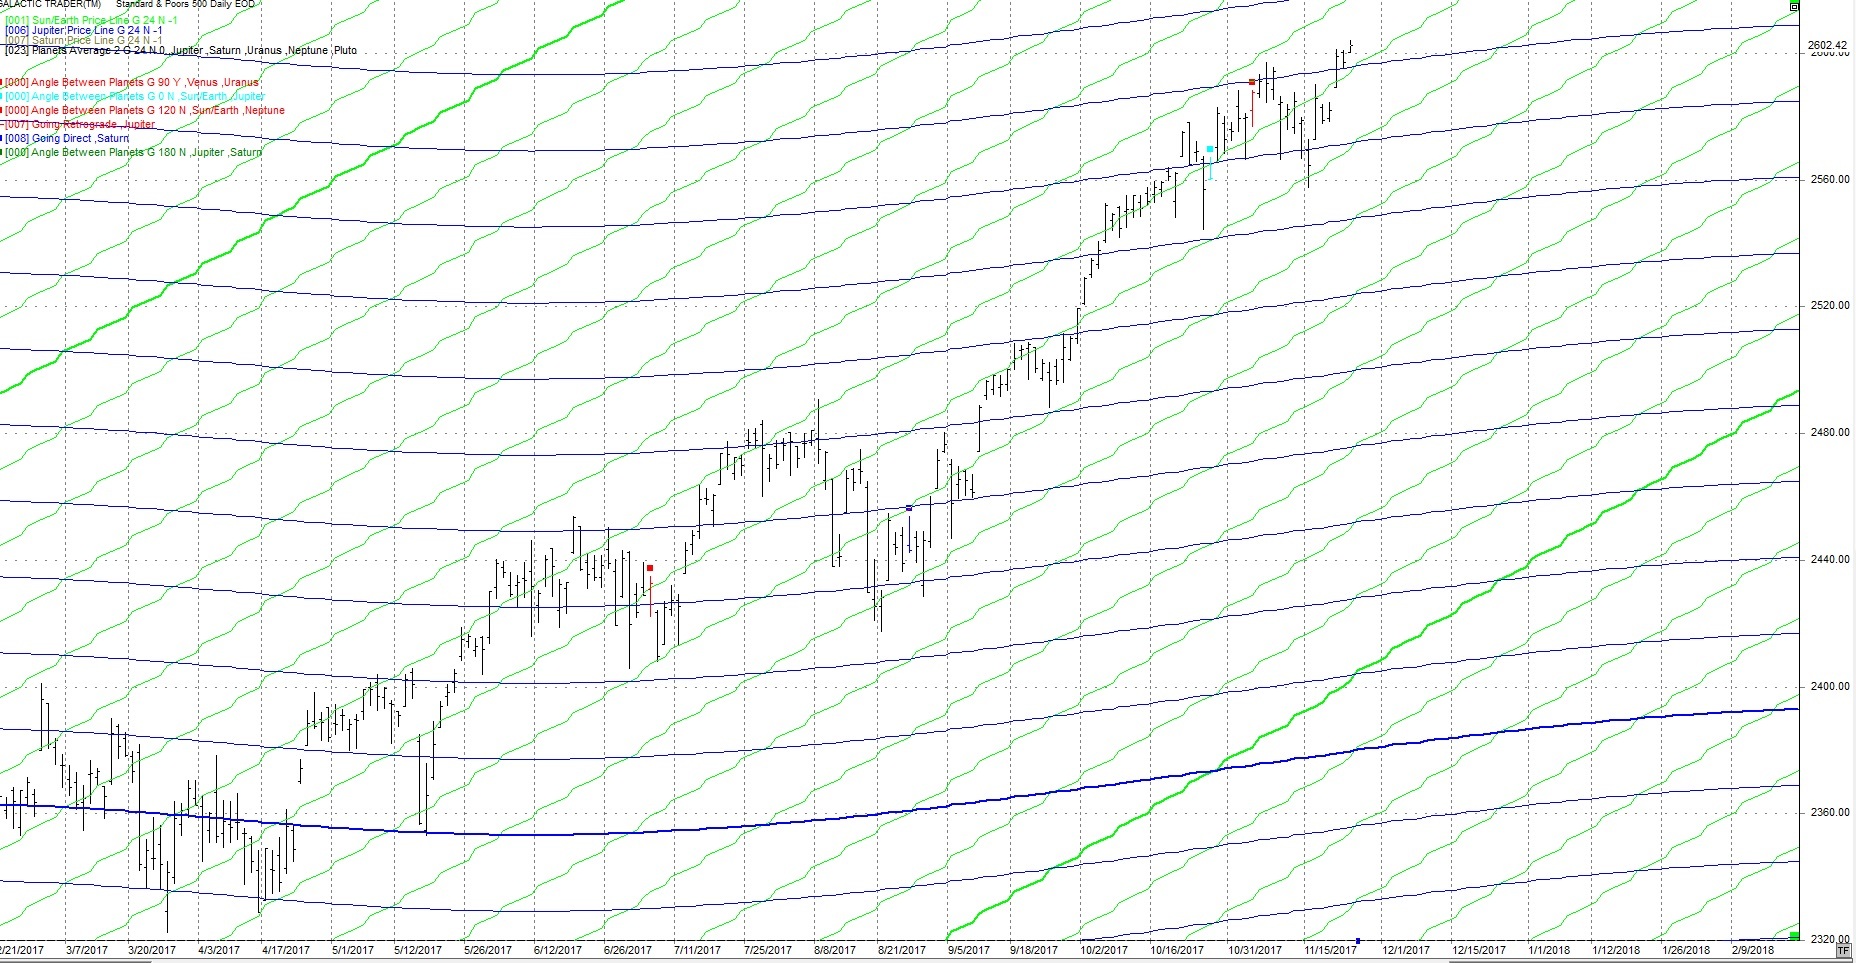
The following daily chart of the SP500 shows the Jupiter price line (blue) and the Sun/Earth price line (green). Both of these price lines have a history of providing support and resistance.
Price has just followed the Sun/ Earth price line down and then bounced up on Nov, 16 and 17th.
The next weekly chart shows the 33 week cycle (light blue circles). It has come in at highs and lows and appears to be close to the 9 month cycle which should be putting in lows the last week of November or first week of December.
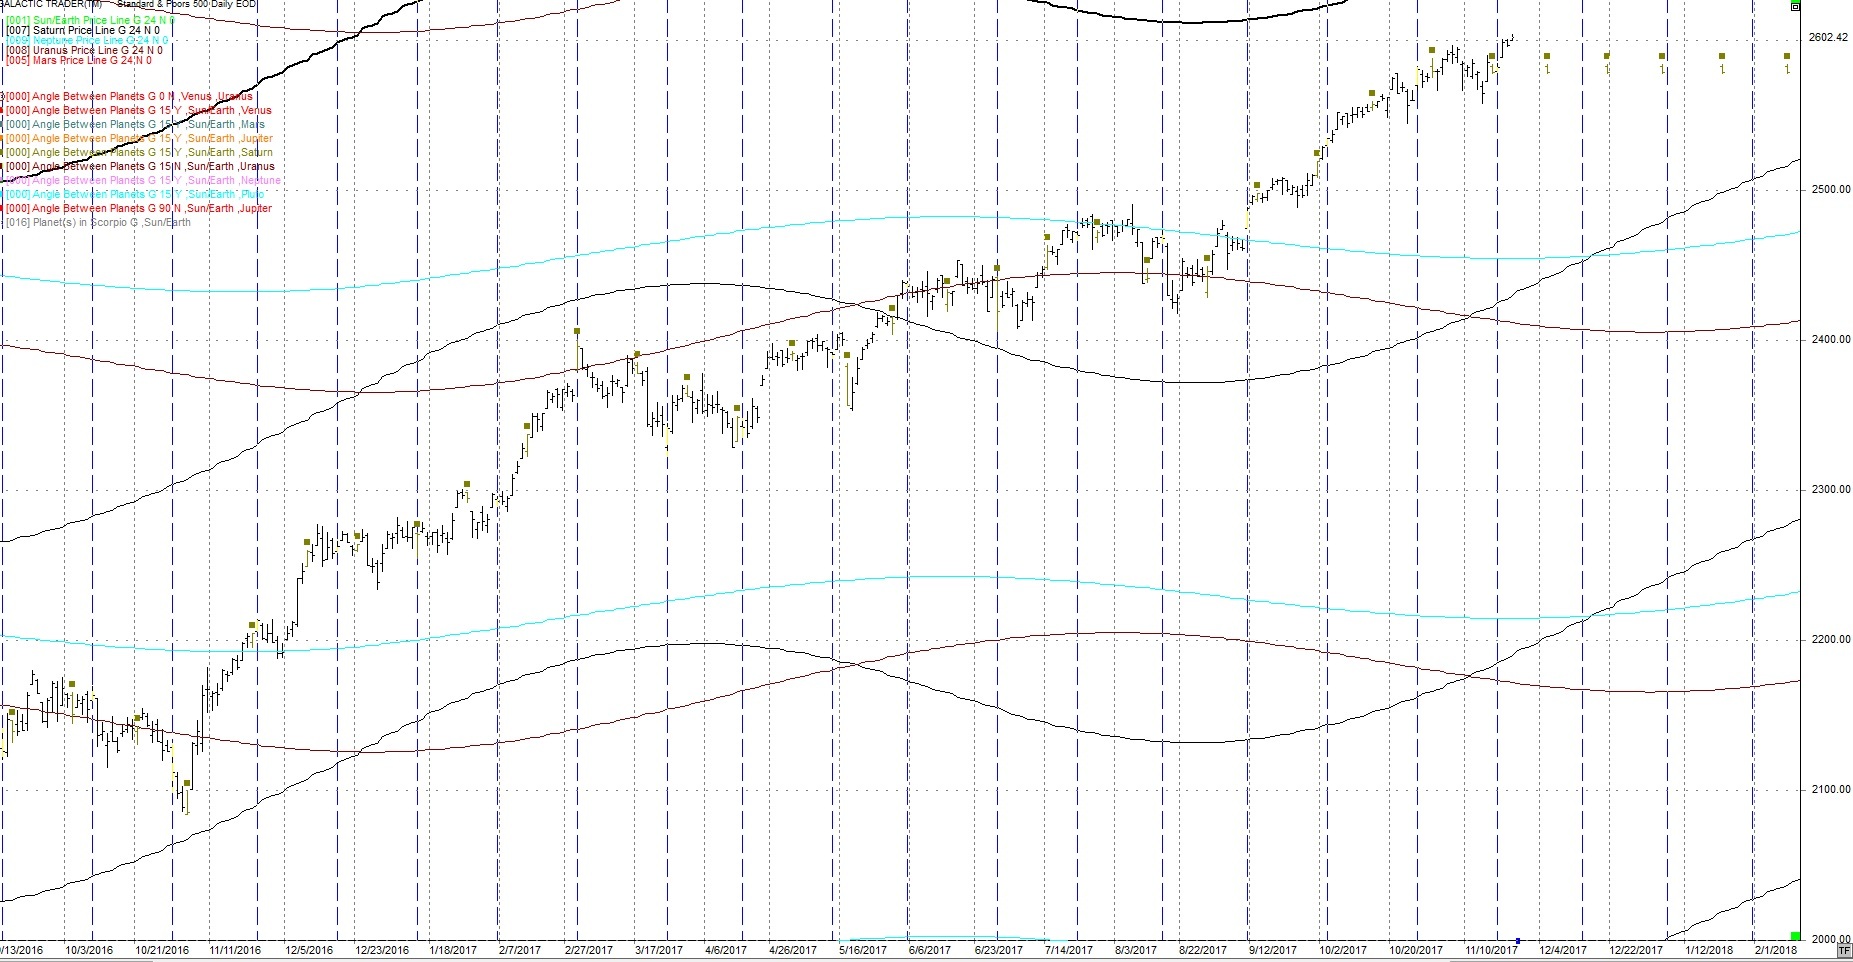
I continue to watch the 24th harmonic cycle (360 / 24) cycles for short term turns. The brown squares are Sun / Saturn 24 degrees on the following daily chart. The blue vertical lines are 24 cd’s (calendar days).
The next hit is Dec.5th, Dec. 21st.
I have added 3 price lines to this chart.
Saturn - black
Uranus - purple
Neptune - light blue
These price lines can act as support / resistance. It has been at highs and lows. Note also when they cross often gets a reaction in price on a short-term basis. Also note, near the top of the chart is a light blue line. This is the Neptune Price Line. Note how it has been strong resistance to price but has broken through. It should act as strong support when the market turns down.
Also watch around November 10 / 11 where the Saturn and Uranus Price Lines cross.
In summary with the aspects in front of us I’m looking for a move down by December 6th but wary of surprises.
“What everyone is looking for, is what is looking."
-- St. Francis of Assisi
Author

TradingDaze
Aisys Technologies Inc.
Gordon Lawson, aka TradingDaze, is a Canadian CPA, certified computer programmer and Astrologer. My traditional career spanned 25 years as a Financial Analyst at Suncor and Manager of Information Systems at BP Resources Canada. After this time Mr.


