Cycle Trading: Weekend Report Preview

The Dollar
Thursday's swing high & Friday's bearish follow through signals that the daily cycle decline has begun.
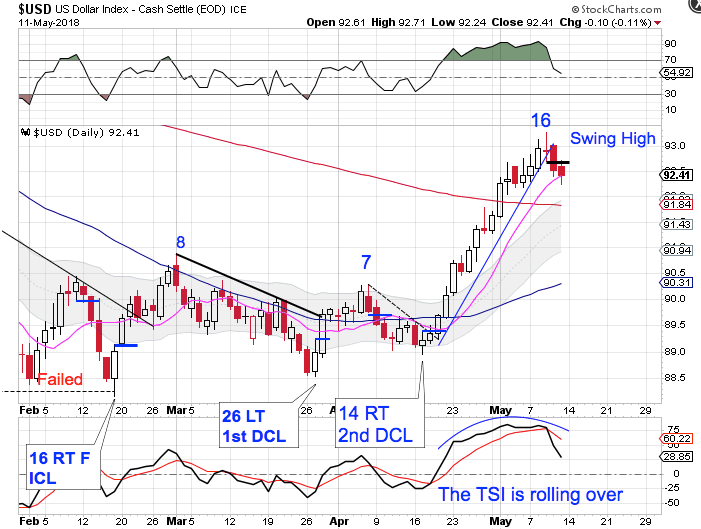
Friday was day 18 for the daily dollar cycle. The dollar has closed below both the daily cycle trend line and the 10 day MA to confirm the daily cycle decline. However, the dollar is in a daily uptrend. It will remain in its uptrend unless it closes below the lower daily cycle band.
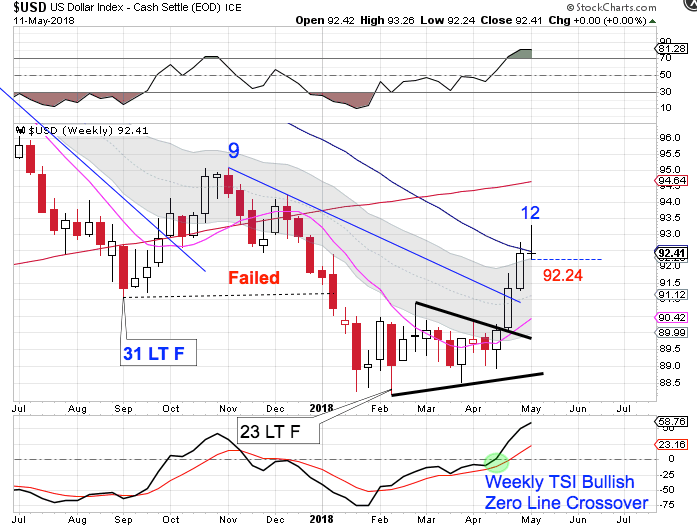
The dollar has broke above the 50 week MA to print a new weekly high this week. A new high on week 12 shifts the odds towards a right translated weekly cycle formation. But the bearish reversal has eased the parameters for forming a weekly swing high. And the dollar was not able to close above the 50 week MA. A break below 92.24 will form a weekly swing high to signal that the weekly cycle is in decline. The dollar has established a new weekly uptrend. It will remain in its uptrend unless it closes below the lower weekly cycle band.
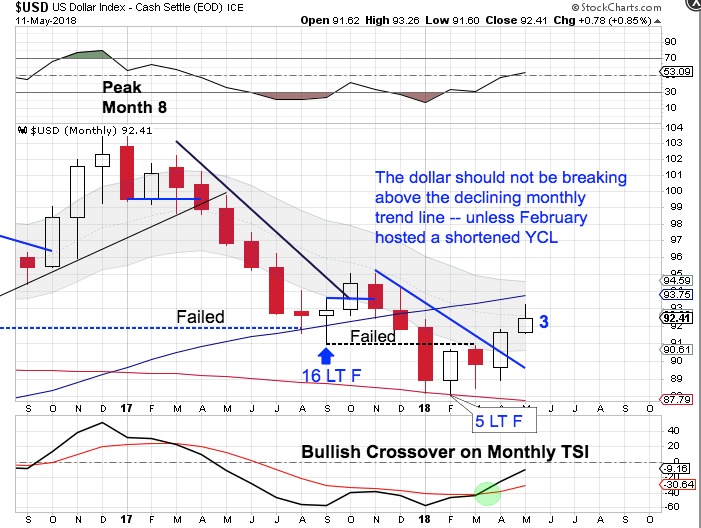
The dollar broke above the declining monthly trend line in April and is delivering bullish follow through in May. The dollar should not have broke above the declining monthly trend line unless February actually hosted a yearly cycle low.
The bigger picture is that the dollar is declining into its 3 year cycle low. Our cyclical expectation is to see left translated yearly cycles. So an early YCL sets up for the next yearly cycle to be stretched. The dollar is in a monthly downtrend. The dollar will remain in its monthly downtrend until it can close back above the upper monthly cycle band.
The dollar has established a pattern of lower monthly highs and lower monthly lows and has begun its decline into its 3 year cycle low. With February hosting an early yearly cycle low sets up for an extended yearly cycle decline. Once a monthly swing high forms the dollar should begin its final decline into its 3 year cycle low.
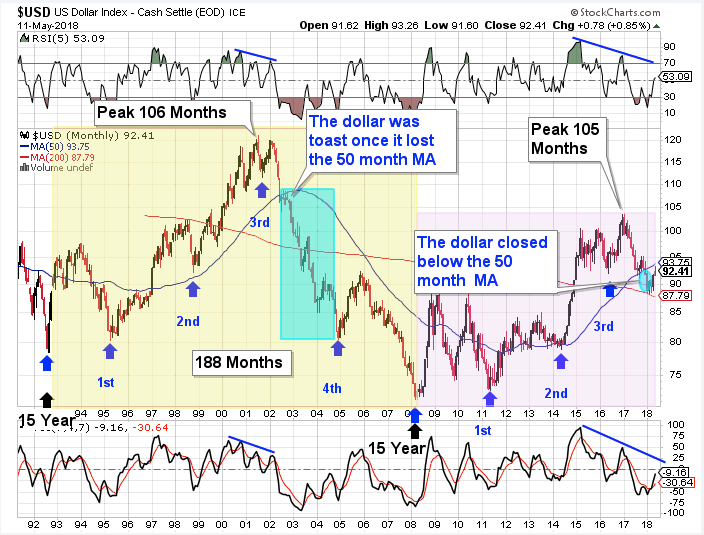
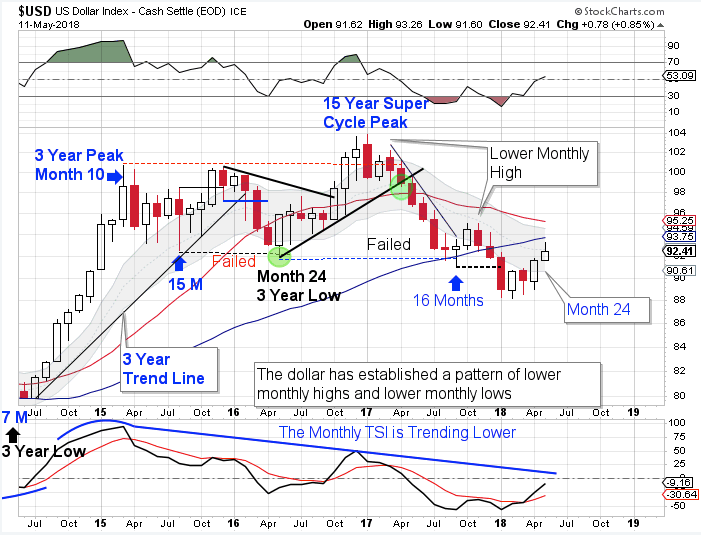
The dollar cycles through a 15 year super cycle. Each 15 year super cycle is embedded with five 3 year cycles. The dollar’s last 15 year super cycle peaked in 2001 on month 106, then declined into its third 3 year cycle low. The topping pattern in 2001 is very similar to the current set up. The confirmation of a failed 3 year cycle confirms that the dollar has begun its 15 year super cycle decline (bear market).
Stocks
While 23 days is normally too short for a DCL, it is looking more & more like day 23 did host the DCL.
Our rationale to label day 23 as the DCL includes:
* Swing Low off of support at the 200 day MA
* Closed above the 10 day MA
* Closed above the declining trend line.
* Delivered a bullish TSI Zero Line Crossover
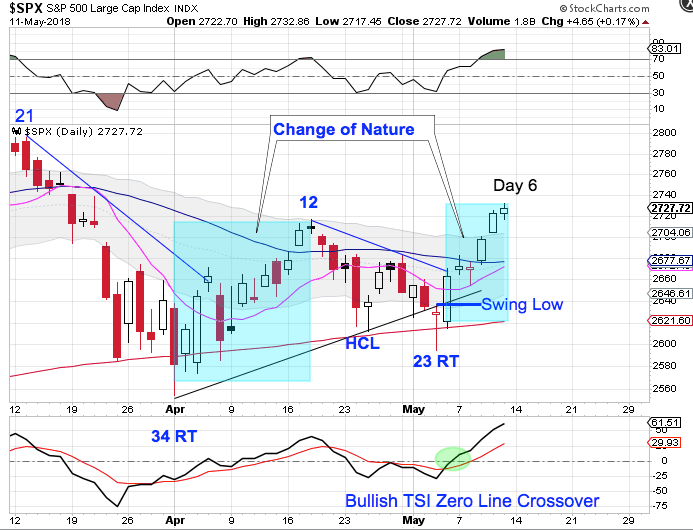
Additional evidence:
* Stocks closed above the 50 day MA
* Stocks have begun to turn the 10 DMA higher
* Closing above the upper daily cycle band.
* Apparent change of nature.
There was more volatility as stocks emerged from the previous day 34 DCL. And stocks were also unable to close above the upper daily cycle band. The rally out of the day 23 low has been stronger. And closing above the upper daily cycle band ends the daily downtrend and begins a daily uptrend.
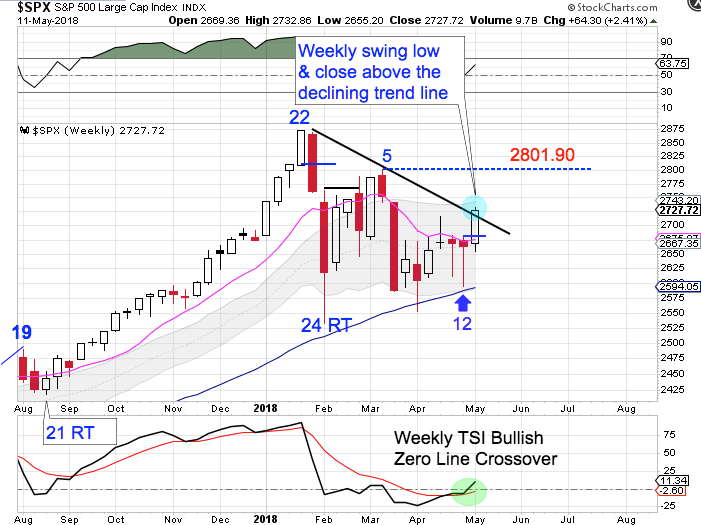
Stocks have been forming a weekly triangle consolidation with the upper stem being the declining weekly trend line and the lower stem being the rising 50 week MA. This weekly triangle consolidation has obscured our weekly cycle counts. I have considered that either week 8 or week 12 hosted an early intermediate low, which is supported by the evidence that was discussed earlier this week. But both scenarios are just too early for an ICL. So while a weekly swing low accompanied by a bullish break above the declining weekly trend line usually signals a new weekly cycle, I think that the correct cycle count is that this was week 13. Stocks will need to break above the week 5 high of 2801.90 to form a right translated weekly cycle.
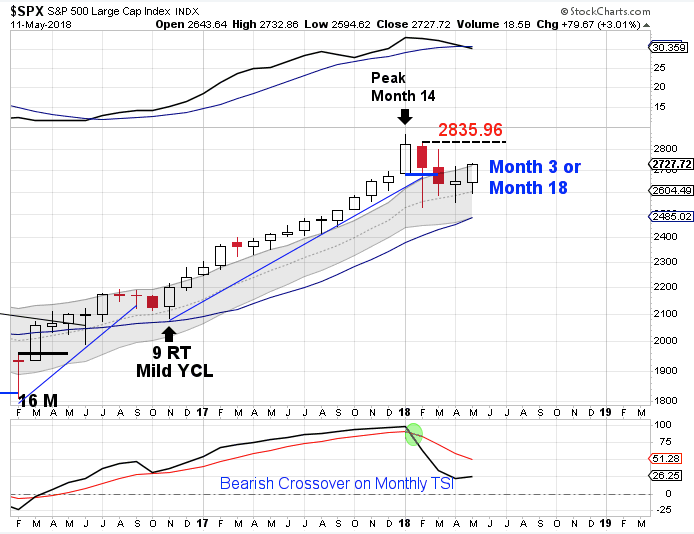
The yearly equity cycle peaked in January. Stocks have formed a clear and convincing monthly swing high and delivered a break of the monthly trend line to signal the yearly cycle decline. February was month 15, placing stocks late in their timing band for a yearly cycle low. A monthly swing low is required in order to confirm a new yearly cycle. Barring a break lower, stocks would need to break above the February high of 2835.96 in order to form a monthly swing low.
Author

LikesMoney
Independent Analyst
Assets (such as stocks, gold, and the dollar) have identifiable cycles.


