Cycle Trading: Weekend Report Preview
The Dollar
The dollar continued to rally this week to close above the 200 day MA. Closing above the 200 day MA helps to affirm my belief that the dollar printed a shortened YCL in February.
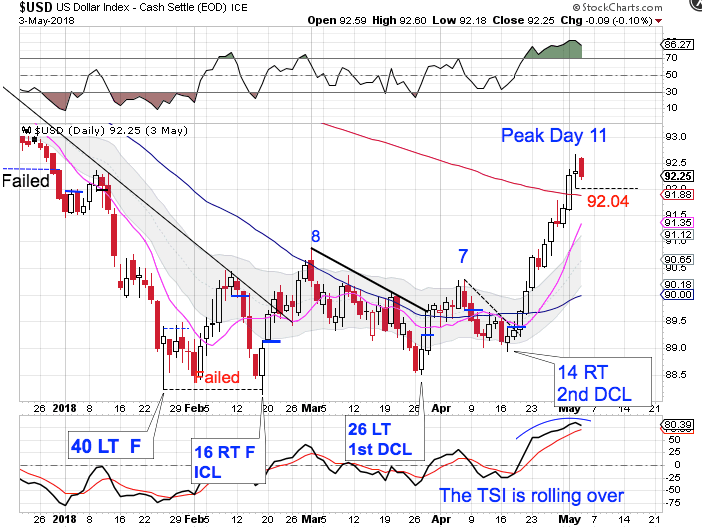
The dollar printed its highest point on Thursday. However, Friday's bearish candle eases the parameters for forming a swing high. A break below 92.04 will form a swing high. A close below the 200 day MA will signal that the daily cycle is in decline. The dollar is in a daily uptrend. It will remain in its uptrend unless it closes below the lower daily cycle band.
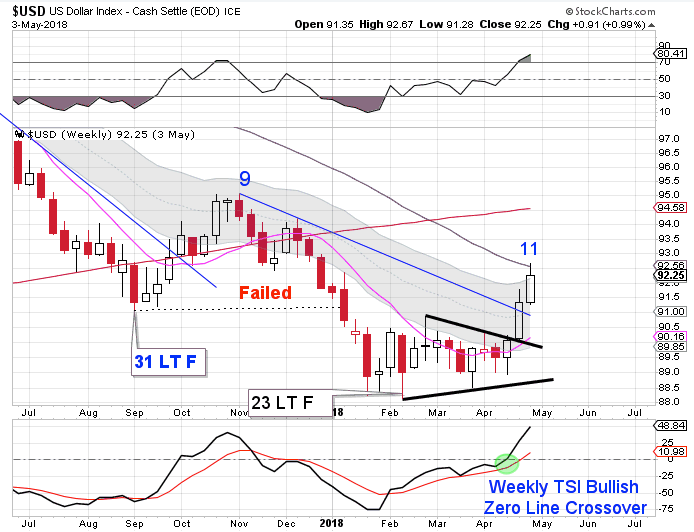
The dollar has broke out of the weekly consolidation and has printed a new weekly high this week. A new high on week 11 starts to shift the odds towards a right translated weekly cycle formation. The dollar also closed above the upper weekly cycle band. This signals an end to the weekly downtrend and the beginning of a new weekly uptrend. But the dollar's advance was halted by the declining 50 day MA, which will likely send the dollar into a daily cycle decline.
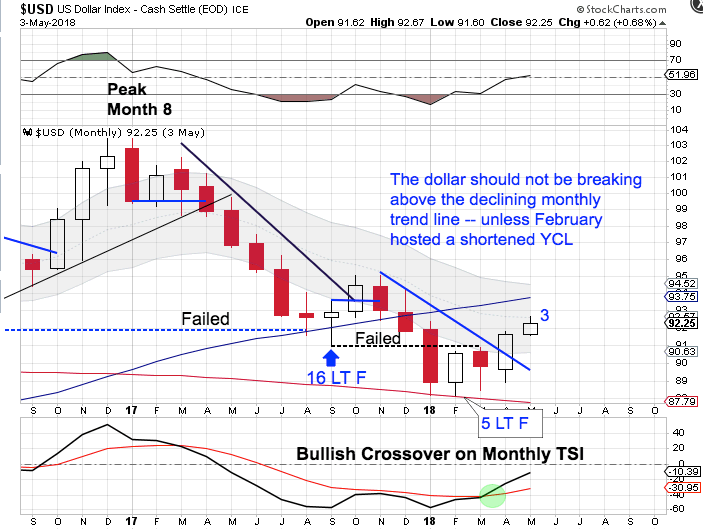
The dollar broke above the declining monthly trend line in April and is delivering bullish follow through in May. The dollar should not have broke above the declining monthly trend line unless February actually hosted a yearly cycle low.
The bigger picture is that the dollar is declining into its 3 year cycle low. Our cyclical expectation is to see left translated yearly cycles. The dollar is in a monthly downtrend. The dollar will remain in its monthly downtrend until it can close back above the upper monthly cycle band.
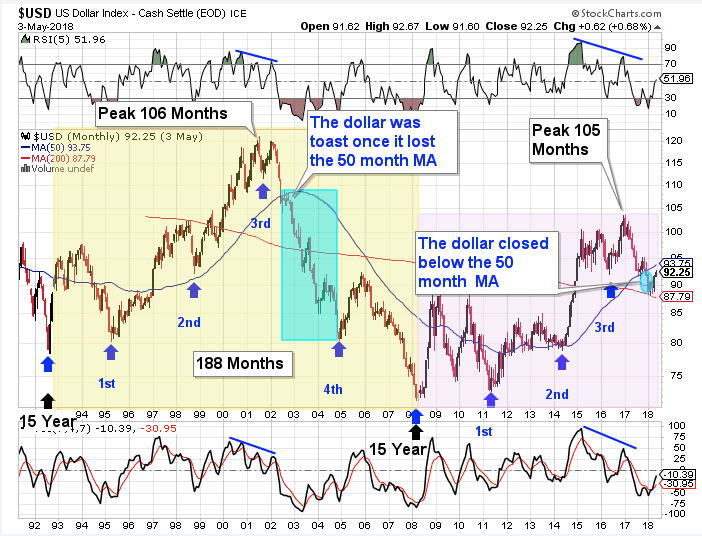
The dollar broke below the previous 3 year cycle low in September to form a failed 3 year cycle. A failed 3 year cycle confirms that the 15 year super cycle is in decline. The dollar then delivered another failed yearly cycle in January. Since the dollar broke below the May 2016 low in September to form a failed 3 year cycle it has been our expectation has been to see left translated yearly cycles form until the dollar prints its next 3 year cycle low.

The dollar cycles through a 15 year super cycle. Each 15 year super cycle is embedded with five 3 year cycles. The dollar’s last 15 year super cycle peaked in 2001 on month 106, then declined into its third 3 year cycle low. The topping pattern in 2001 is very similar to the current set up. The confirmation of a failed 3 year cycle confirms that the dollar has begun its 15 year super cycle decline (bear market).
Stocks
Stocks printed its lowest point on Thursday, day 23. That is 7 days shy of its normal timing band for a daily cycle low.
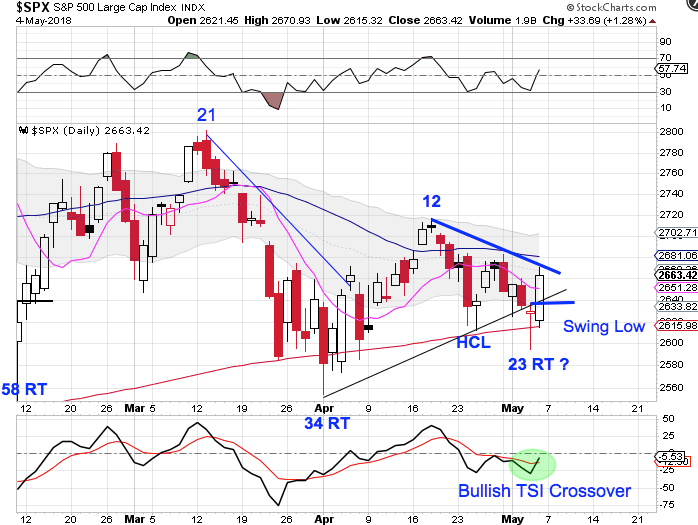
Stocks formed a swing low on Friday. So a case can be made that Friday was a half cycle low. However, I am in the camp that Friday was a daily cycle low. Part of my thinking is that in real time the decline into the day 17 low did not turn the 10 day MA lower. But the decline into the day 23 low did turn the 10 day MA lower.
The other reason why day 23 could be the daily cycle low is how stocks have been behaving at the 200 day MA for this bull market.
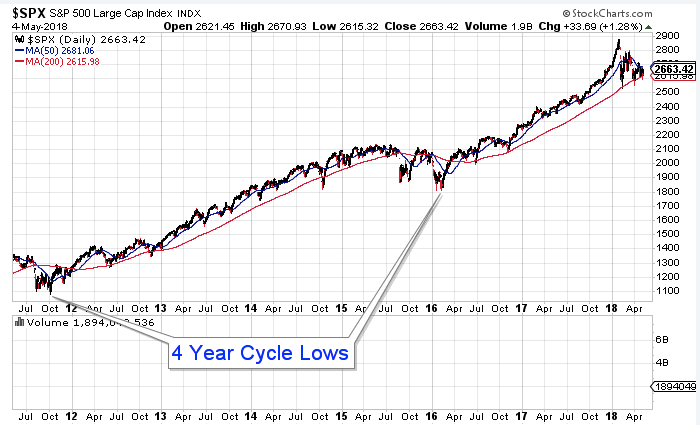
Looking back over the past several years it is undeniable that stocks have been in a bullish uptrend. The only times that stocks spent any significant time below the 200 day MA was during the previous 4 year cycle declines. Otherwise stocks have been receiving support at the 200 day MA. Since stocks are only 2 years into the current 4 year cycle, there is still plenty of time to rally higher. Therefore that shifts the odds towards the 200 day MA providing support for an early 23 day, daily cycle low.
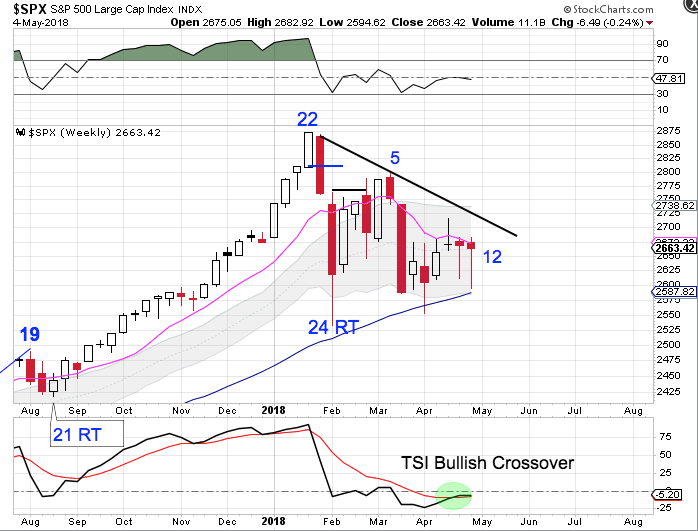
Stocks are forming a weekly triangle consolidation with the upper stem being the declining weekly trend line and the lower stem being the rising 50 week MA. The peak on week 5 sets up a left translated weekly cycle formation. Left translated cycles typically fail. A failed weekly cycle here would extend the yearly cycle decline. However, we need to be prepared for a bullish swing low forming in the apex of the triangle consolidation. A bullish break above the declining weekly trend line under this scenario would signal a new weekly cycle.
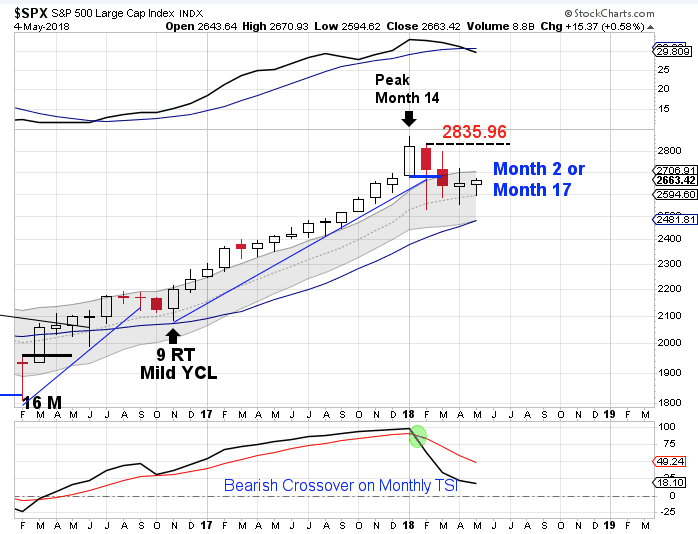
The yearly equity cycle peaked in January. Stocks have formed a clear and convincing monthly swing high and delivered a break of the monthly trend line to signal the yearly cycle decline. February was month 15, placing stocks late in their timing band for a yearly cycle low. A monthly swing low is required in order to confirm a new yearly cycle. Barring a break lower, stocks would need to break above the February high of 2835.96 in order to form a monthly swing low.
Author

LikesMoney
Independent Analyst
Assets (such as stocks, gold, and the dollar) have identifiable cycles.


