Cycle Trading: Weekend Report Preview
The Dollar
Friday's break below the daily cycle trend line confirms that the dollar is in a daily cycle decline.
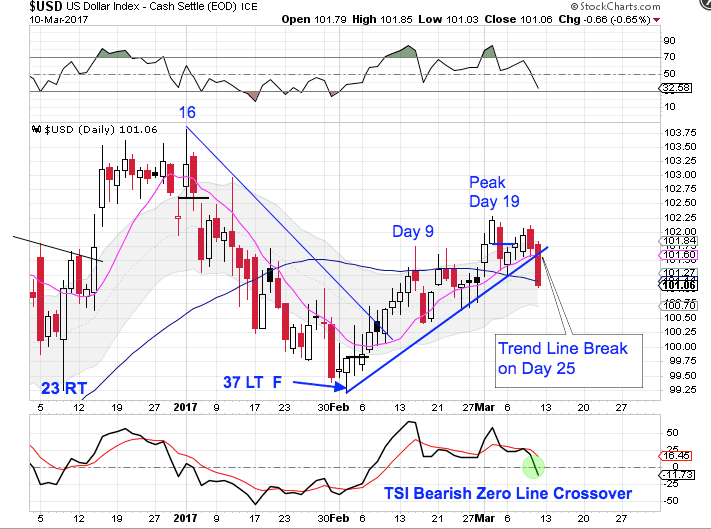
The dollar peaked on day 19, which assures us of a right translated daily cycle formation. The dollar also managed to close above the upper daily cycle band during this daily cycle. That ended the daily downtrend and indicated that February hosted an intermediate cycle low. Friday was day 25 for the dollar's daily cycle. That places the dollar in its timing band for a daily cycle low. A swing low will signal a new daily cycle. The dollar is in a daily uptrend and will continue in its uptrend until it closes below the lower daily cycle band.
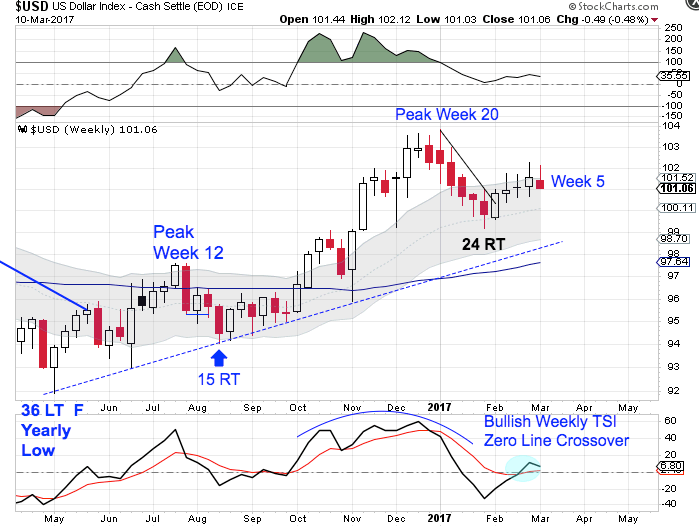
The dollar is in its timing band to decline into a yearly cycle low. A left translated failed weekly cycle is needed to signal the yearly cycle decline. Left translated weekly dollar cycles usually peak by week 8. So with this being week 5, once a daily cycle low forms, the next daily cycle should form as a left translated daily cycle.
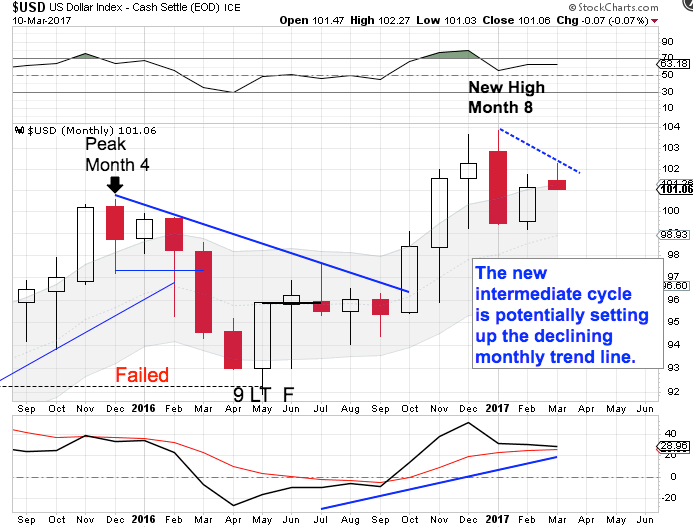
March is month 10 for the yearly dollar cycle. That places the dollar in its timing band to seek out a yearly cycle low. The new intermediate cycle is potentially setting up the declining monthly trend line. The dollar will now need to break below the February low of 99.19 in order to complete its yearly cycle decline.
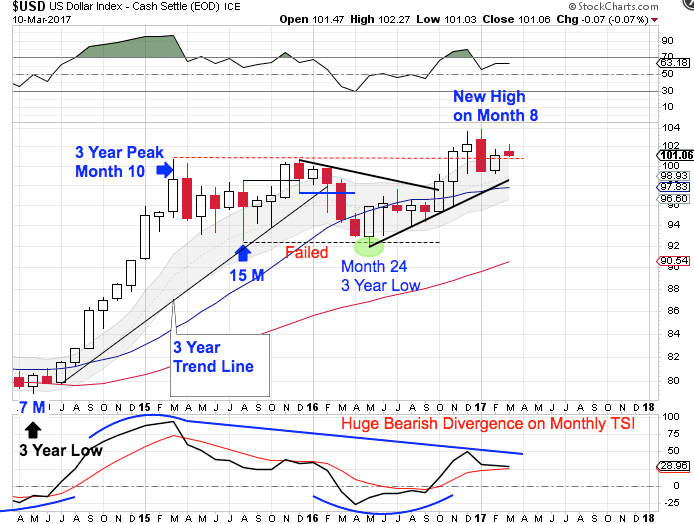
The dollar printed a failed yearly cycle in May to confirm the 3 year cycle decline for the dollar. The dollar has since printed new monthly highs. Since a cycle cannot fail and then print a higher high, this confirms that May was an early 3 year cycle low. That makes March month 10 for the new 3 year cycle.
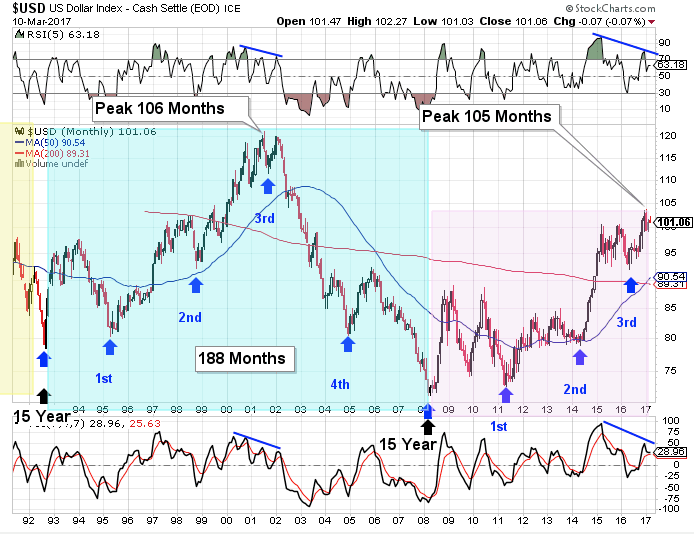
The dollar cycles through a 15 year super cycle. Each 15 year super cycle is embedded with five 3 year cycles. The dollar’s last 15 year super cycle peaked in 2001 on month 106, then declined into its third 3 year cycle low. There are some similarities developing to the current set up. Currently, the dollar has printed a new high in January, which is month 105 for the 15 year super cycle. Which is about when the previous super cycle rolled over into its 15 year super cycle decline. At the previous super cycle peak the dollar was quite stretched above the 200 month MA as well as the 50 month MA — as it is right now. There are bearish divergences developing on the momentum indicators that also appeared at the previous 15 year super cycle peak.
May hosted the 3 year cycle low, which was a shortened 3 year cycle of only 24 months. Since most times cycle balances themselves out, we could be poised for the next 3 year cycle to be a stretched 3 year cycle just as the dollar is ready to begin its 15 year super cycle decline. And a stretched 3 year dollar cycle decline would align with gold beginning a new multi year bull cycle.
Stocks
The daily cycle peaked on day 40, locking in a right translated daily cycle formation.
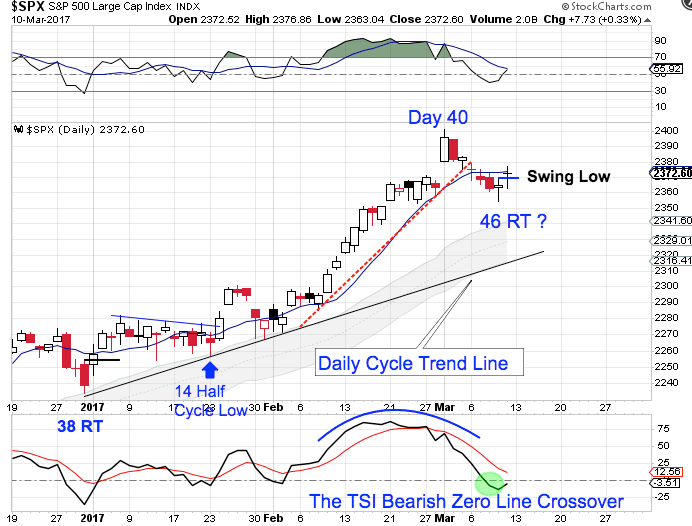
Stocks printed their lowest point on Thursday, following the day 40 peak. The swing low on Friday indicates a new daily cycle. A close above the 10 day MA will signal a new daily cycle. Stocks continue to close above the upper daily cycle band, indicating a daily uptrend. Stocks will remain in its daily uptrend until it closes below the lower daily cycle band.
Normally we would like to see break below the daily cycle trend line before looking for a daily cycle low. But this daily cycle is extremely right translated and it did not happen. Setting aside the trend line break there are other signals that help to determine a daily cycle low. Timing band is one of the criteria. Also normally present in a daily cycle decline is the TSI delivering a bearish zero line crossover also along with the formation a weekly swing.
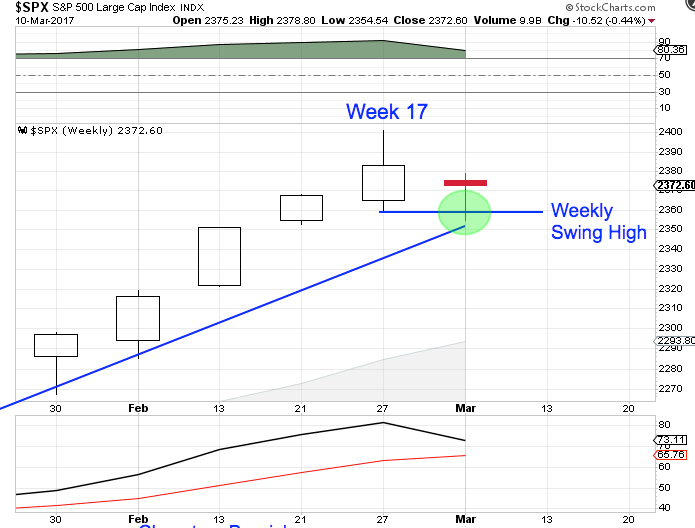
Stocks did form a weekly swing high this week.
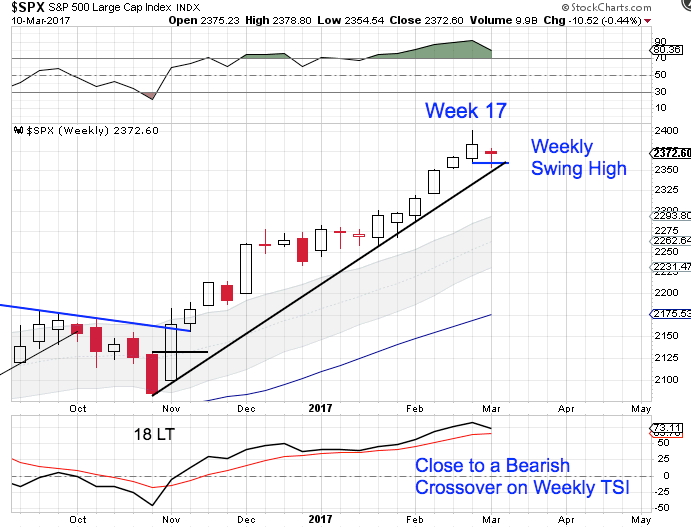
But stocks did not break below the intermediate trend line to signal that the intermediate cycle is in decline. Since a failed daily cycle is needed to confirm the intermediate cycle decline, the right translated daily cycle formation makes it likely that stocks will need at least one more daily cycle in order to decline into an intermediate cycle low. Which should take the intermediate cycle out to late April or into May. Stocks continue to close above the upper weekly cycle band remaining in its daily uptrend. Stocks will continue its weekly uptrend until it closes below the lower weekly cycle band.
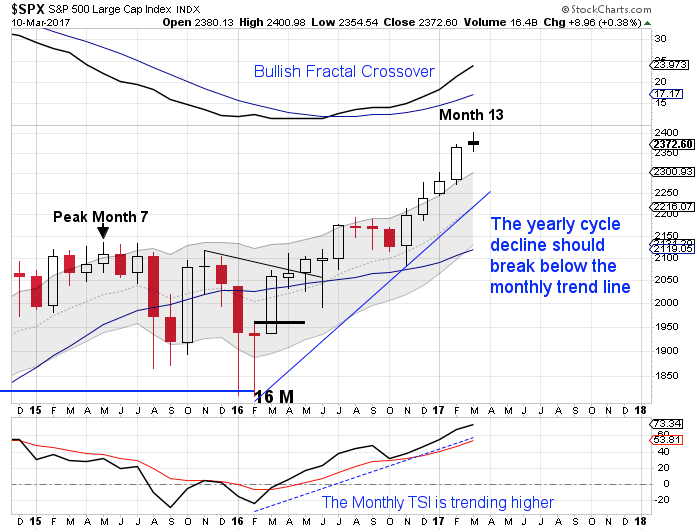
March is month 13 for the yearly equity cycle. The new high locks in a right translated yearly cycle formation. Stocks are now in their timing band for seeking out their yearly cycle low. A monthly swing high accompanied by a break of the monthly trend line will confirm the yearly cycle decline. Once stocks begin their intermediate cycle decline that should also trigger the yearly cycle decline.
Author

LikesMoney
Independent Analyst
Assets (such as stocks, gold, and the dollar) have identifiable cycles.


