Cycle Trading: Weekend Report Preview
The Dollar
The dollar broke above the 50 day MA on Wednesday. But then formed a bearish reversal and closed below the 50 day MA. Thursday the dollar formed a swing high to signal the daily cycle decline.
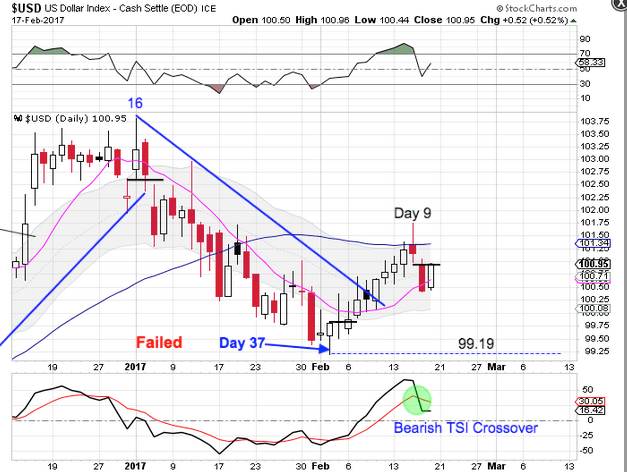
The dollar recovered on Friday. We could see the dollar back test the 50 day MA before continuing into its daily cycle decline. A "kiss good-bye" will set up a declining trend line. A peak on day 9 can still result in a left translated failed daily cycle. A break below 99.19 will form a failed daily cycle.
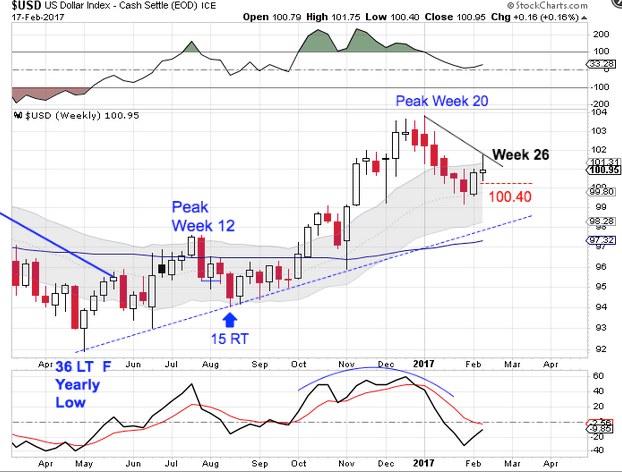
The dollar peaked on week 20. It should break below the blue dashed trend line in order to complete its intermediate cycle decline. A weekly swing low here will set the declining weekly trend line. A break below 100.40 will form a weekly swing low. The dollar is in a weekly uptrend and will remain in its weekly uptrend unless it closes below the lower weekly cycle band.
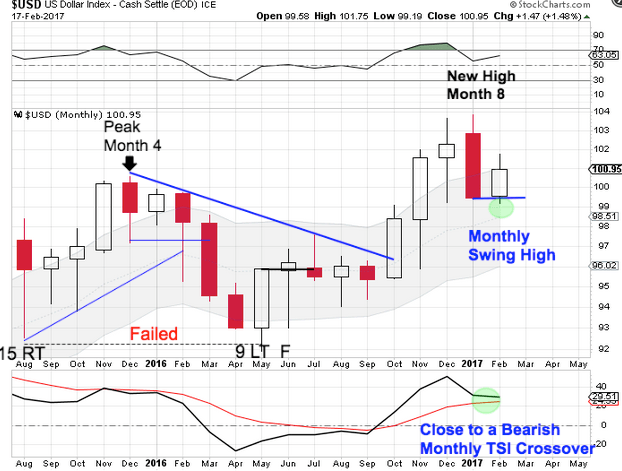
The dollar has formed a monthly swing high to signal the start of the yearly cycle decline. A high on month 8 assures us of a right translated yearly cycle formation. Following a failed yearly cycle, if the dollar is still declining into its 3 year cycle low then the dollar should continue to form left translated, failed yearly cycles. The right translated yearly cycle formation indicates that May hosted the 3 year cycle low.
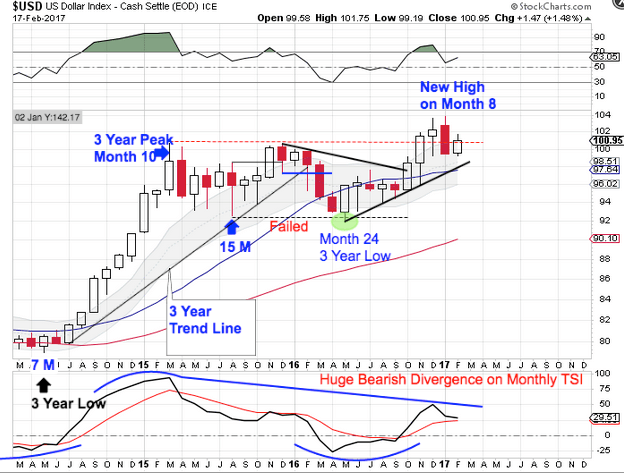
Printing a failed yearly cycle in May confirmed the 3 year cycle decline for the dollar. The dollar has now gone on to print a higher monthly high. Since a cycle cannot fail and then print a higher high, this confirms that May was an early 3 year cycle low. That makes February month 9 for the new 3 year cycle.
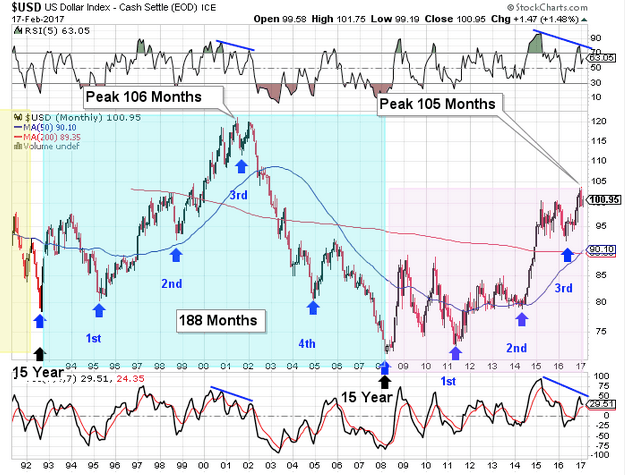
The dollar cycles through a 15 year super cycle. Each 15 year super cycle is embedded with five 3 year cycles. The dollar’s last 15 year super cycle peaked in 2001 on month 106, then declined into its third 3 year cycle low. There are some similarities developing to the current set up. Currently, the dollar has printed a new high in January, which is month 105 for the 15 year super cycle. Which is about when the previous super cycle rolled over into its 15 year super cycle decline. At the previous super cycle peak the dollar was quite stretched above the 200 month MA as well as the 50 month MA — as it is right now. There are bearish divergences developing on the momentum indicators that also appeared at the previous 15 year super cycle peak.
May hosted the 3 year cycle low, which was a shortened 3 year cycle of only 24 months. Since most times cycle balances themselves out, we could be poised for the next 3 year cycle to be a stretched 3 year cycle just as the dollar is ready to begin its 15 year super cycle decline. And a stretched 3 year dollar cycle decline would align with gold beginning a new multi year bull cycle.
Stocks
Stocks have entered their timing band to seek out a daily cycle low. Thursday's new high on day 32 locks in a right translated daily cycle formation.
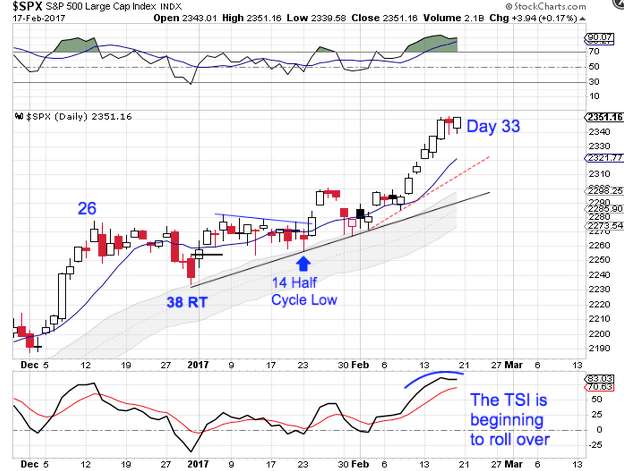
A swing high and a break of the accelerated trend line will signal the daily cycle decline. Stocks continue to close above the upper daily cycle band remaining in its daily uptrend. Stocks will continue its daily uptrend until it closes below the lower daily cycle band.
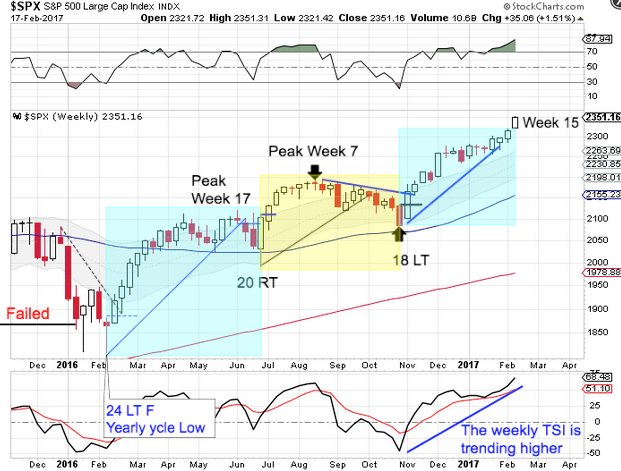
The new high on week 15 shifts the odds towards a right translated weekly cycle formation. This is the 3rd intermediate cycle of the year. The yearly cycle is typically comprised of 2 - 3 intermediate cycles. If this intermediate cycle is going to host the yearly cycle decline then it will likely need one more daily cycle to do so. Allowing for the completion of the current daily cycle and then one more daily cycle will stretch the intermediate cycle out to April or May. Stocks continue it their weekly uptrend. They will remain in their weekly uptrend until they close below the lower weekly cycle band.
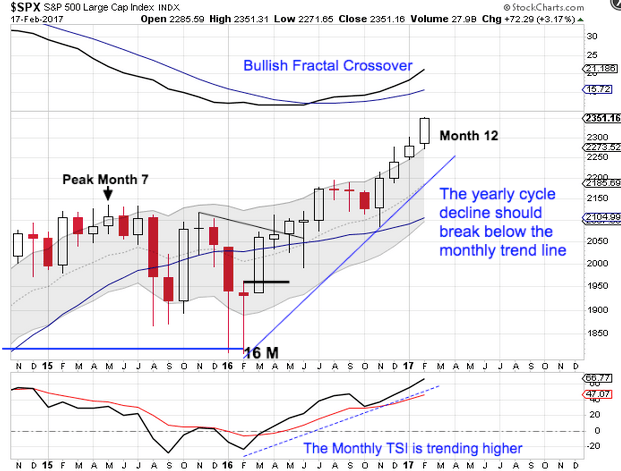
February is month 12 for the yearly equity cycle. The new high locks in a right translated yearly cycle formation. Stocks are now in their timing band for seeking out their yearly cycle low. A monthly swing high accompanied by a break of the monthly trend line will confirm the yearly cycle decline. Once stocks begin their intermediate cycle decline that should also trigger the yearly cycle decline.
Author

LikesMoney
Independent Analyst
Assets (such as stocks, gold, and the dollar) have identifiable cycles.
More from LikesMoney


