Cycle Trading: The Weekend Report Preview

The Dollar
The dollar printed its lowest point on day 37, following the day 26 peak. That placed the dollar deep in its timing band for a daily cycle low.
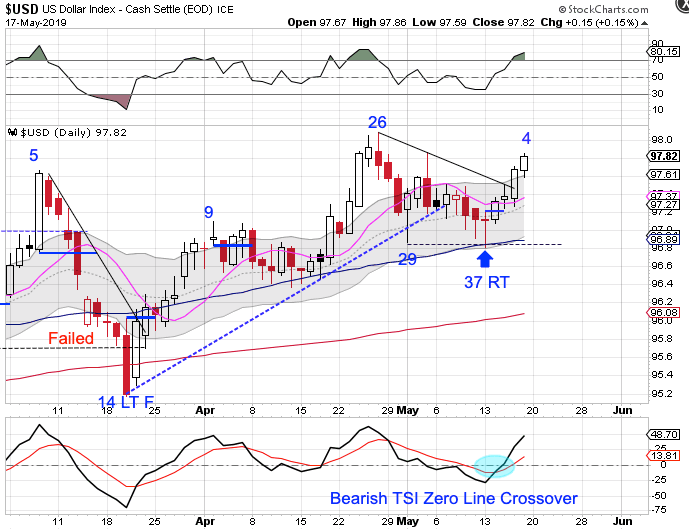
The dollar formed a swing low on Tuesday and broke above the declining trend line on Thursday to confirm the new daily cycle. The dollar continues to close above the upper daily cycle band, indicating that it is in a daily uptrend. The dollar will remain in its daily uptrend unless it closes below the lower daily cycle band.
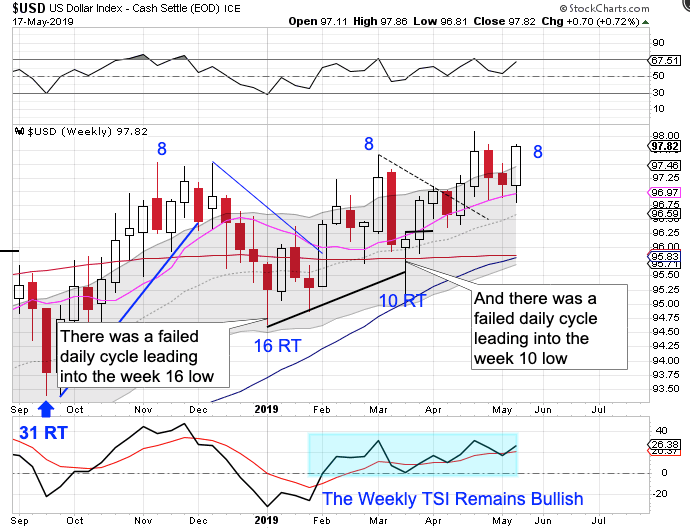
This is week 8 for the dollar's intermediate cycle. The dollar is late in its timing band to begin its yearly cycle decline. A left translated weekly cycle formation is needed for the yearly cycle decline. So we are watching for signs of a possible left translated weekly cycle formation. The first such indication would be for the new daily cycle to form as a left translated daily cycle. However, the dollar remains firmly in a weekly uptrend. It will continue its weekly uptrend unless it closes below the lower weekly cycle band.
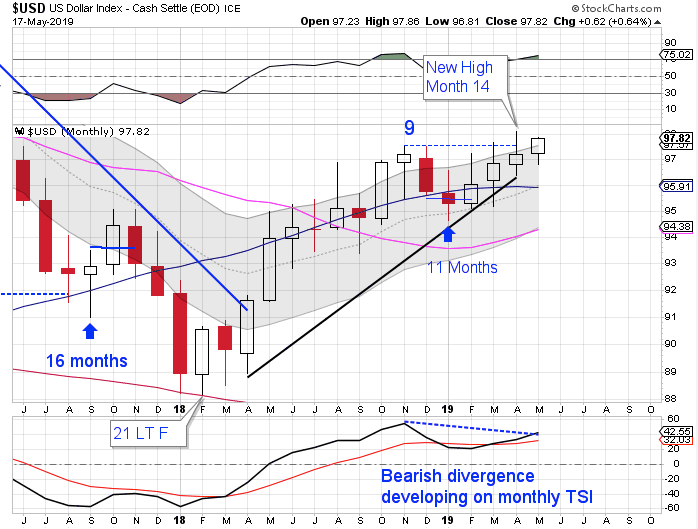
The dollar printed its lowest point in January, month 11, following the month 9 peak. That placed the dollar in its timing band for a yearly cycle low. However, there has not been a failed weekly cycle to confirm the yearly cycle decline which makes May month 15 for the yearly dollar cycle. That places the dollar late in its timing band for a yearly cycle decline. Therefore once the dollar prints a failed daily cycle, that should trigger the intermediate cycle decline which would lead to the yearly cycle decline. The dollar is in a monthly uptrend. It will remain in its monthly uptrend unless it closes below the lower monthly cycle band.
Stocks
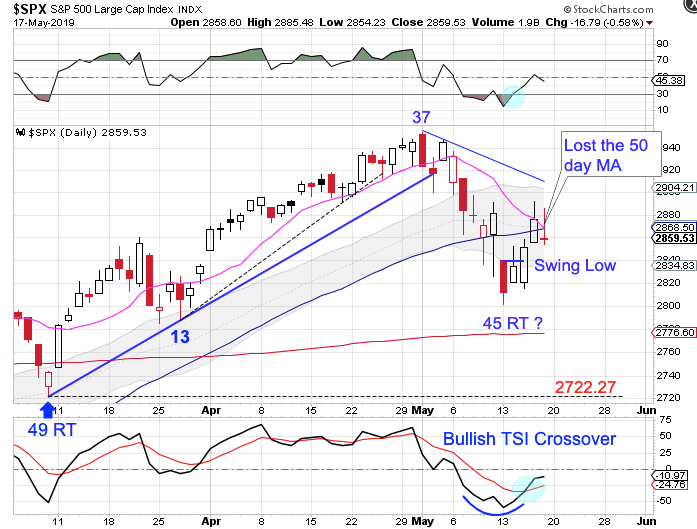
Personally I think that stocks would have printed their daily cycle low on the previous Friday, 5/10/19. However, the escalating trade war with China caused stocks to break lower on Monday.
As we will see on the weekly chart, stocks are in its timing band for an intermediate cycle low. Stocks have formed a weekly swing high and closed below the 10 week MA which signals that the intermediate cycle decline has begun.
Stocks losing the 50 MA on Friday is a warning signal that the gravitational pull of the pending intermediate cycle low will cause stocks to form a failed daily cycle. A break below the previous daily cycle low of 2722.27 will form a failed daly cycle. Since stocks closed below the lower daily cycle band on Monday that ended the daily uptrend and began a daily downtrend.
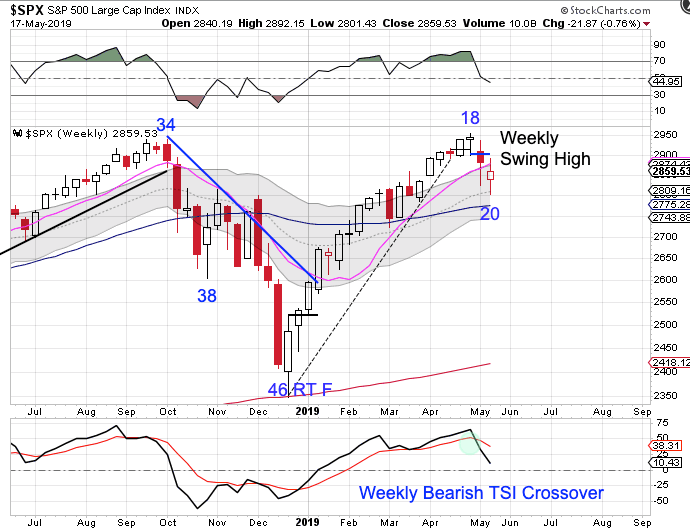
The is week 20 for the intermediate equity cycle. That places stocks in its timing band for an intermediate cycle decline. Stocks have formed a weekly swing high. And stocks are currently below the 10 week MA. All of this signals the beginning of an intermediate cycle decline. Stocks closing below the 50 day MA aligns with this scenario. However, stocks are in a weekly uptrend. They will remain in their weekly uptrend unless they close below the lower weekly cycle band.
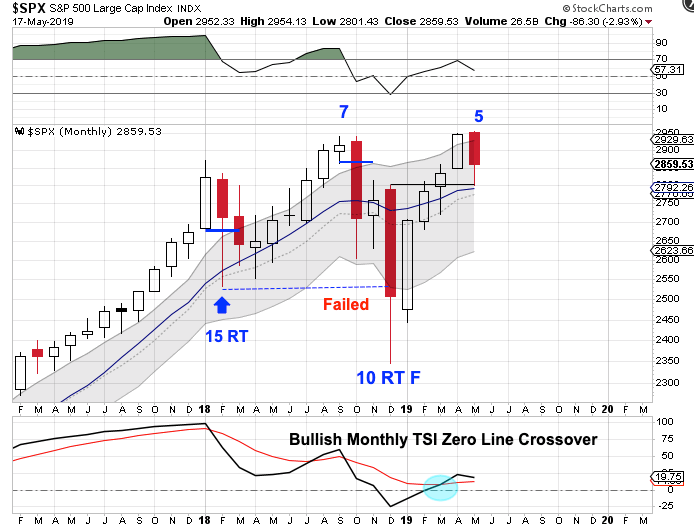
May is month 5 of the yearly equity cycle. Stocks have begun a monthly uptrend. Stocks will continue in their monthly uptrend unless they close below the lower monthly cycle band.
Author

LikesMoney
Independent Analyst
Assets (such as stocks, gold, and the dollar) have identifiable cycles.


