Cycle Trading: The Weekend Report Preview

The Dollar

The dollar closed above the declining trend line and 10 day MA on Wednesday to confirm the new daily cycle.
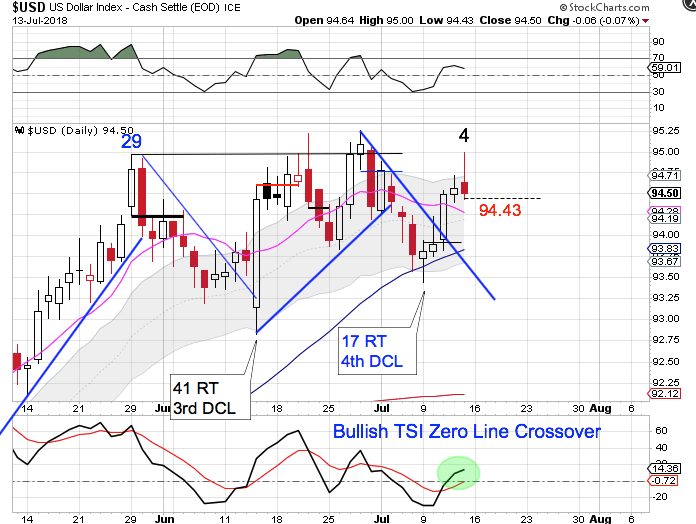
This is the 5th daily cycle for the current intermediate cycle. Therefore we are expecting a left translated daily cycle formation to trigger the intermediate cycle decline. Friday's bearish reversal on day 4 indicates a left translated daily cycle formation. A break below 94.43 will form a daily swing high to signal the daily cycle decline.
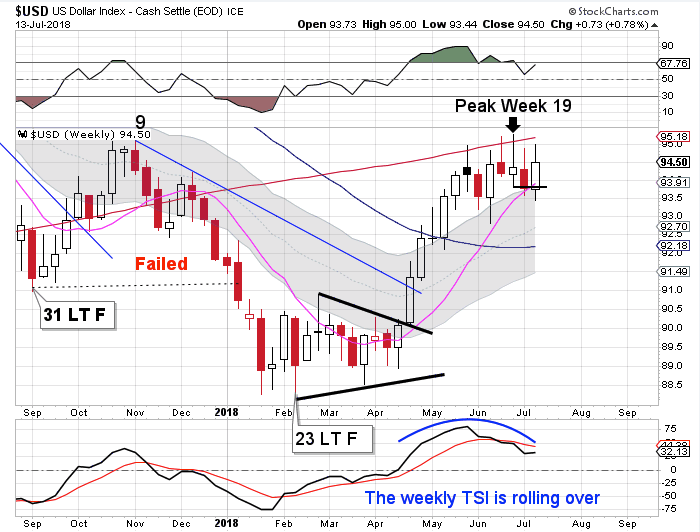
This is week 21 for the intermediate dollar cycle. The dollar is in its timing band for an ICL. Therefore our expectation is to see the new daily cycle left translate so the dollar can complete its intermediate cycle decline. The dollar has already formed a weekly swing high. A close below the 10 week MA will confirm the intermediate cycle decline.
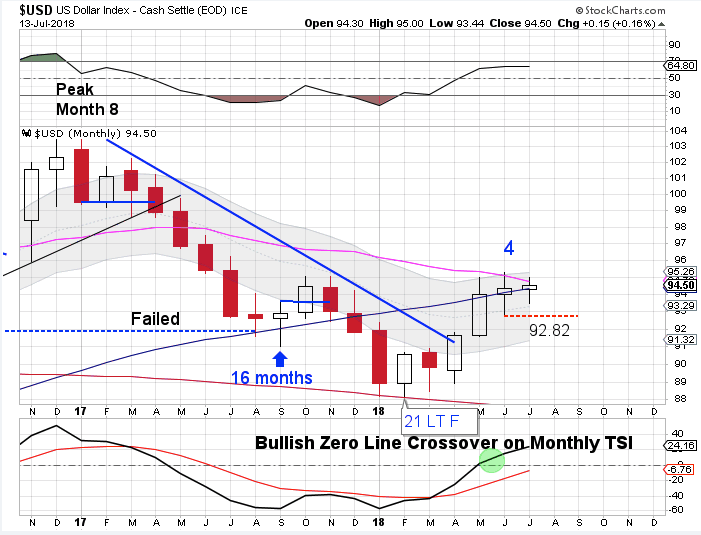
July is month 5 for the yearly cycle. An intermediate decline here could cause the dollar to form a monthly swing high. If a monthly swing high forms off of June, that will set the dollar up for a left translated yearly cycle formation. A break below 92.82 forms a monthly swing high.
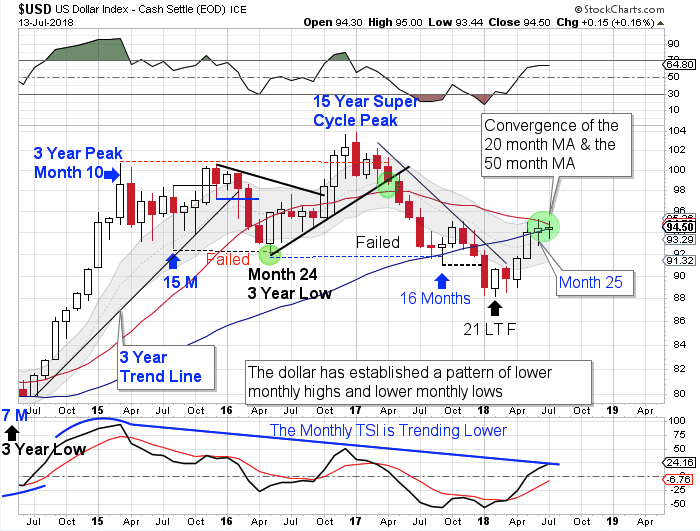
The dollar's 3 year cycle peaked in January, 2017, along with the 15 year Super Cycle peak. The dollar went on to break below the previous yearly cycle low on August, 2017, forming a failed yearly cycle and confirming the yearly cycle decline. The dollar should now print failed yearly cycles until the 3 year cycle low forms.
The failed intermediate cycle leading form the September low extended the yearly cycle out to February - month 21. Our expectation is to see failed yearly cycles until the next 3 year cycle low forms. Rejection from the convergence of the declining 20 month MA and the 50 month MA would align with that expectation.
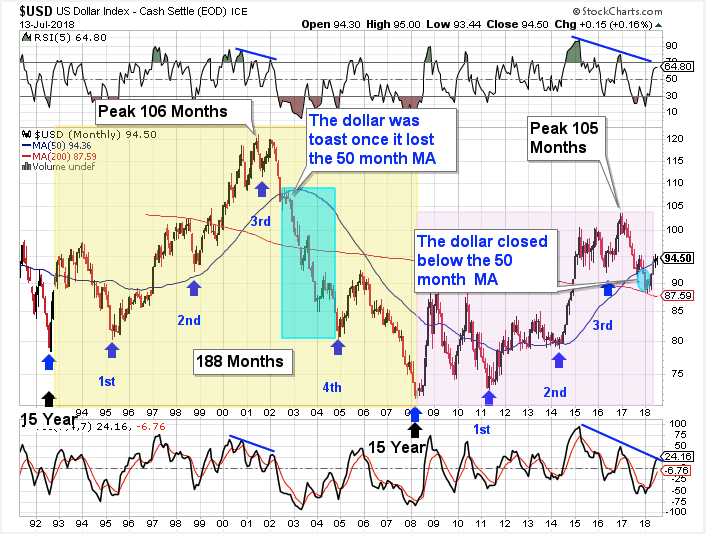
The dollar cycles through a 15 year super cycle. Each 15 year super cycle is embedded with five 3 year cycles. The dollar’s last 15 year super cycle peaked in 2001 on month 106, then declined into its third 3 year cycle low. The topping pattern in 2001 is very similar to the current set up. The confirmation of a failed 3 year cycle back in August, 2017 confirms that the dollar has begun its 15 year super cycle decline (bear market).
Stocks
Stocks printed a new high on Friday, day 10.
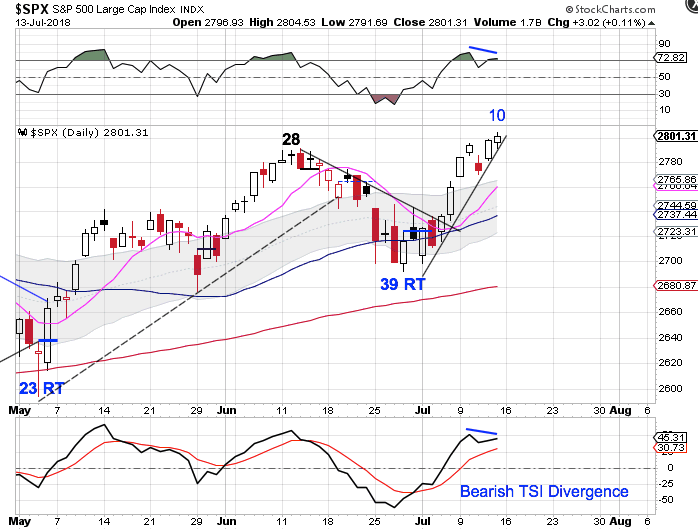
While stocks printed a new high on Friday, there are bearish divergences developing on the oscillators. The status of the intermediate cycle has us expecting a left translated daily cycle formation. A swing high and a break below the daily cycle trend line would indicate that the daily cycle decline has begun. Stocks are in a daily uptrend. They will remain in their uptrend unless they close below the lower daily cycle band.
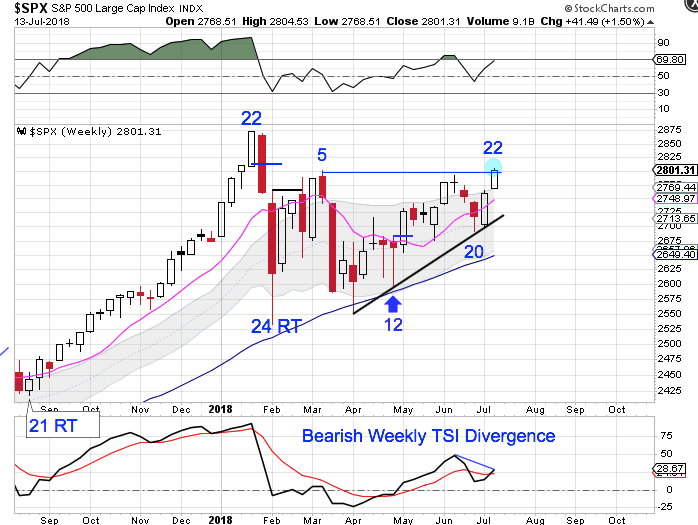
This is week 22 for the intermediate equity cycle, placing stocks in their timing band for an intermediate cycle decline. Stocks broke out above the week 5 high this past week to lock in a right translated weekly cycle formation. Stocks are in their timing band to begin their intermediate cycle decline. We are watching for a left translated daily cycle formation to signal that the intermediate cycle decline has begun.
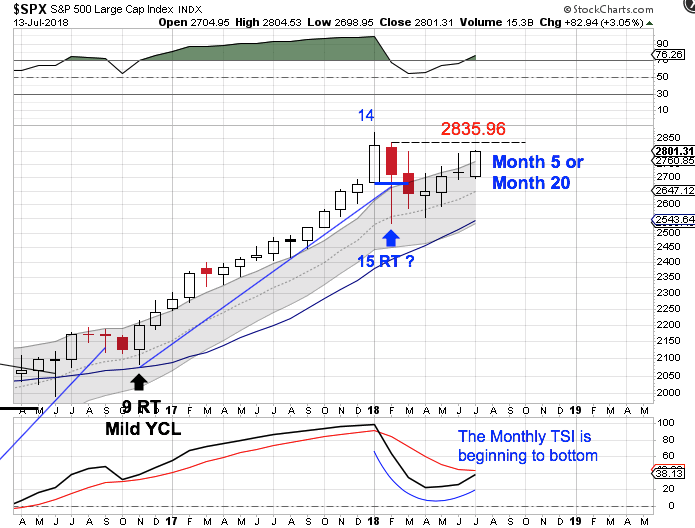
The yearly equity cycle peaked in January. Stocks have formed a clear and convincing monthly swing high and delivered a break of the monthly trend line to signal the yearly cycle decline. Stocks then went on to print their lowest point in February. That was month 15, placing stocks late in their timing band for a yearly cycle low. A monthly swing low is required in order to confirm a new yearly cycle.Stocks need to break above the February high of 2835.96 in order to form a monthly swing low.
Author

LikesMoney
Independent Analyst
Assets (such as stocks, gold, and the dollar) have identifiable cycles.


