Cycle Trading: The Weekend Report Preview
The Dollar
The dollar printed is highest point on Friday, day 23. There are bearish divergences developing on the oscillators which often precedes the daily cycle decline.
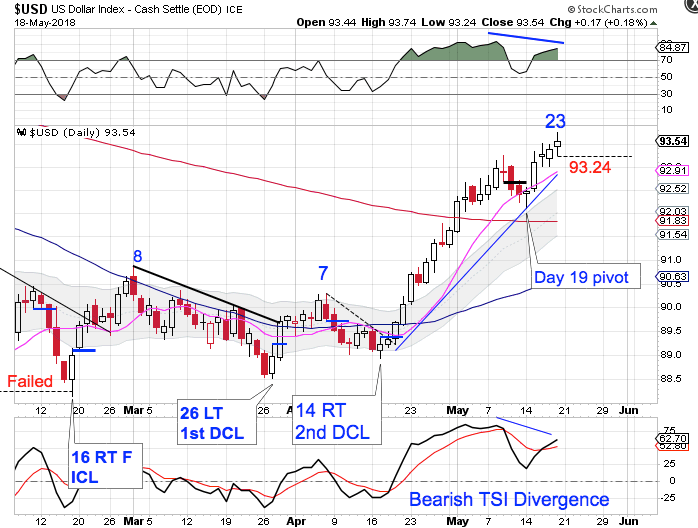
The dollar is in its timing band for a DCL. A swing high & trend line break will confirm the daily cycle decline. A break below 93.24 will form a daily swing high.
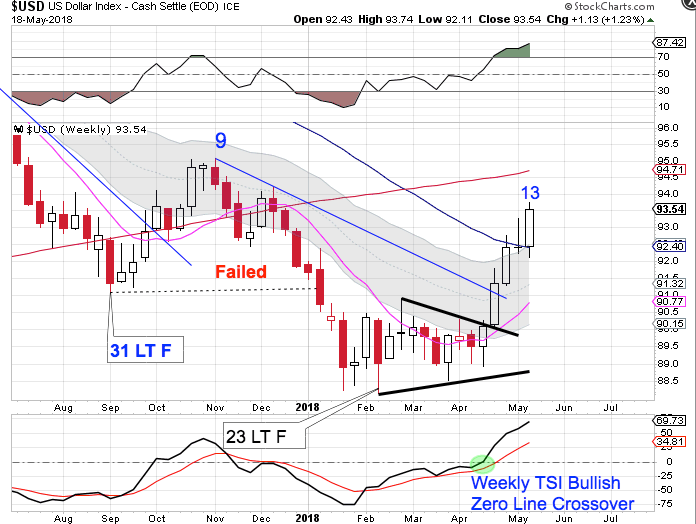
The new high on week 13 shifts the odds towards a right translated weekly cycle formation, which indicates that February hosted a yearly cycle low. The dollar is in a weekly uptrend. It will remain in its uptrend unless it closes below the lower weekly cycle band.
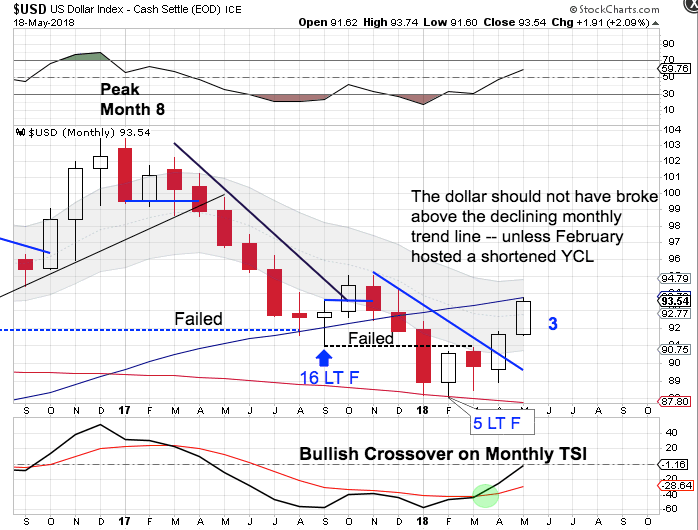
The dollar broke above the declining monthly trend line in April and is delivering bullish follow through in May. The dollar should not have broke above the declining monthly trend line unless February actually hosted a yearly cycle low.
The bigger picture is that the dollar is declining into its 3 year cycle low. Our cyclical expectation is to see left translated yearly cycles. So an early YCL sets up for the next yearly cycle to be stretched. The dollar is in a monthly downtrend. The dollar will remain in its monthly downtrend until it can close back above the upper monthly cycle band.
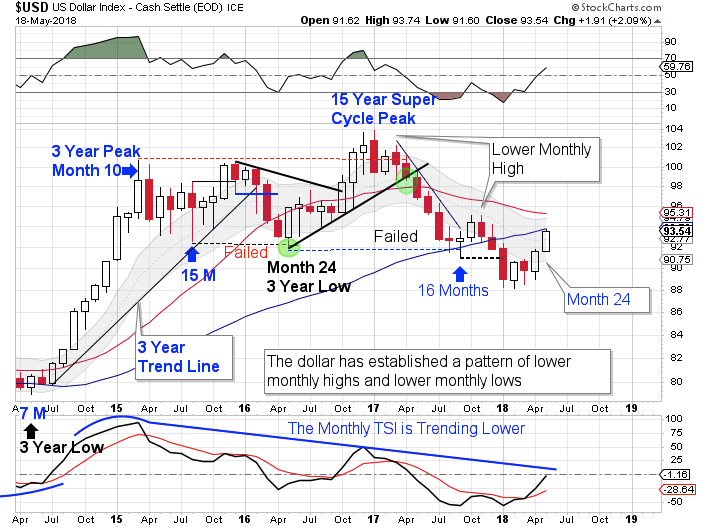
The dollar has established a pattern of lower monthly highs and lower monthly lows and has begun its decline into its 3 year cycle low. With February hosting an early yearly cycle low sets up for an extended yearly cycle decline. Once a monthly swing high forms the dollar should begin its final decline into its 3 year cycle low.
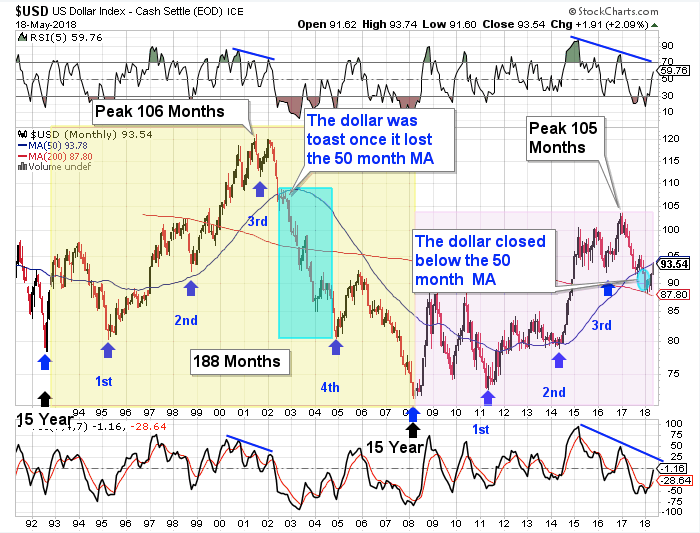
The dollar cycles through a 15 year super cycle. Each 15 year super cycle is embedded with five 3 year cycles. The dollar’s last 15 year super cycle peaked in 2001 on month 106, then declined into its third 3 year cycle low. The topping pattern in 2001 is very similar to the current set up. The confirmation of a failed 3 year cycle confirms that the dollar has begun its 15 year super cycle decline (bear market).
Stocks
Stocks consolidated this week which allowed the 10 day MA to catch up to price.
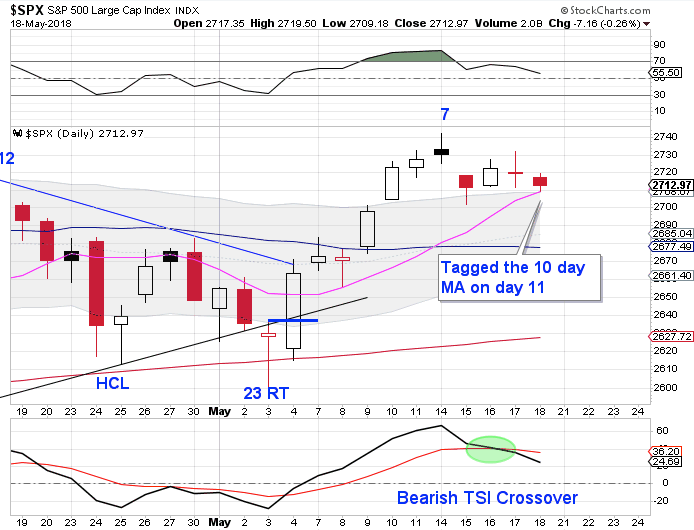
Stocks tagged the rising 10 day MA on Friday. Stocks are in a daily uptrend. If a swing low forms above the lower daily cycle band they will remain in their daily uptrend.
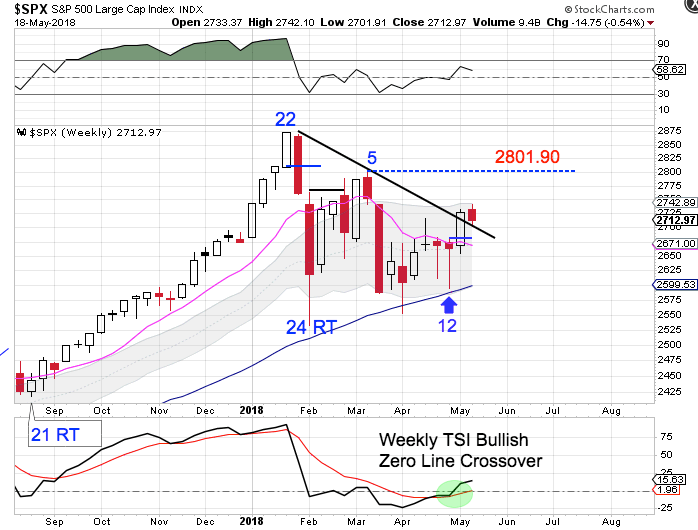
This is week 14 for the intermediate equity cycle. Stocks appear to have back tested the declining weekly trend line. Stocks will need to break above the week 5 high of 2801.90 to form a right translated weekly cycle.
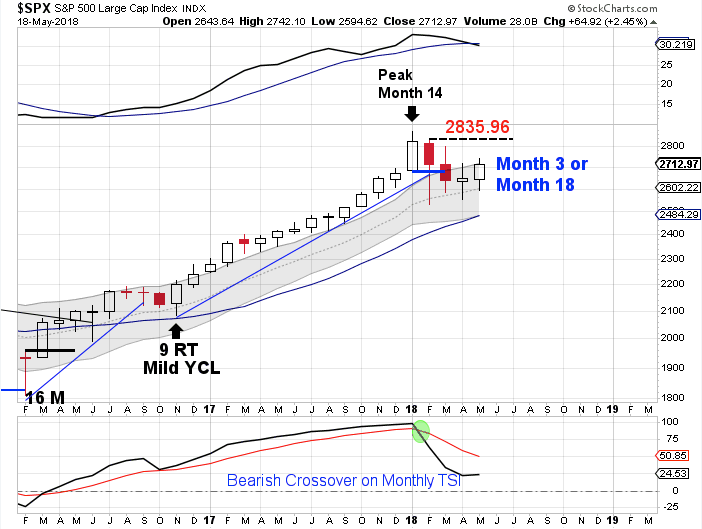
The yearly equity cycle peaked in January. Stocks have formed a clear and convincing monthly swing high and delivered a break of the monthly trend line to signal the yearly cycle decline. February was month 15, placing stocks late in their timing band for a yearly cycle low. A monthly swing low is required in order to confirm a new yearly cycle. Barring a break lower, stocks would need to break above the February high of 2835.96 in order to form a monthly swing low.
Author

LikesMoney
Independent Analyst
Assets (such as stocks, gold, and the dollar) have identifiable cycles.


