Cycle Trading: The Weekend Report Preview

The Dollar
The dollar closed below the lower daily cycle band on Thursday. This indicates a continuation of the intermediate cycle decline.
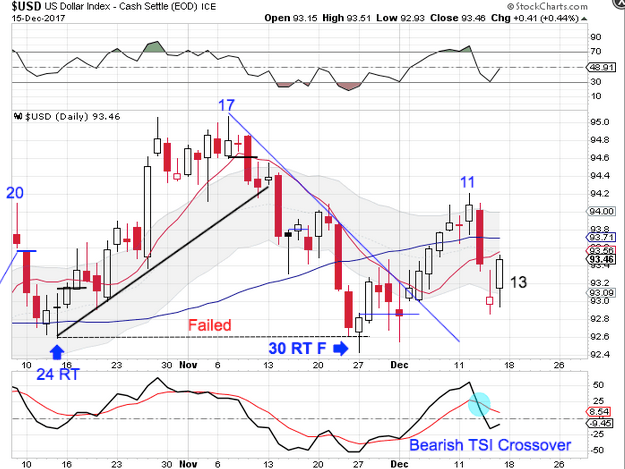
The dollar printed its lowest point on Thursday. At 12 days, that is too early to expect a DCL. The dollar then formed a swing low on Friday. It is likely that this is a counter trend rally to back test the 50 day MA.
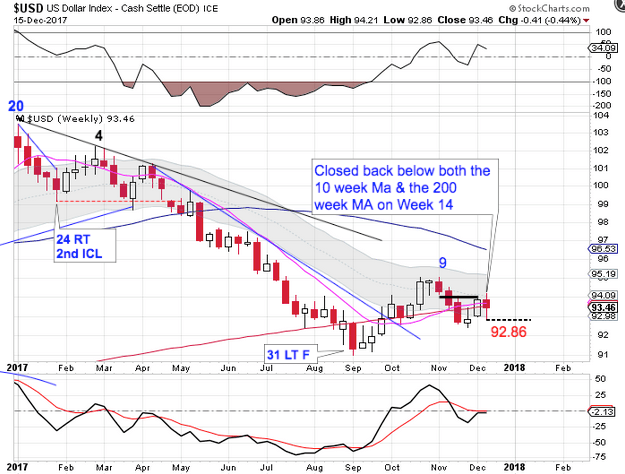
The intermediate cycle peaked on week 9, then printed it lowest point on week 12, which is too early for an ICL. The dollar closed back above the 10 week & 200 week MA the previous week. However, this week it closed back below both the 10 week MA and the 200 week MA. A weekly swing high here would allow us to construct the declining trend line. A break below 92.86 will form a weekly swing high. And at 13 weeks the dollar can trend lower for another 5 - 8 weeks before printing an ICL. The dollar is in a weekly downtrend & will remain so unless it closes above it the upper weekly cycle band.
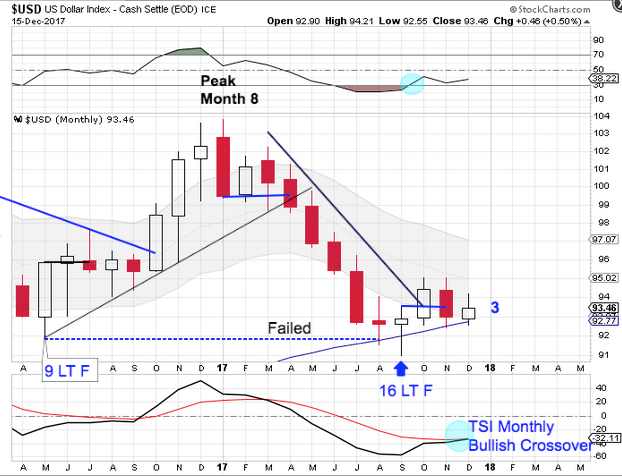
The dollar printed its lowest point in September, month 16. A monthly swing low formed in October along with a break above the declining monthly trend line to confirm the new yearly cycle. The dollar is teetering right on the 50 month MA. A close below the 50 month MA will signal that the yearly cycle decline has begun. The dollar is in a monthly downtrend. The dollar will remain in its monthly downtrend until it can close back above the upper monthly cycle band.
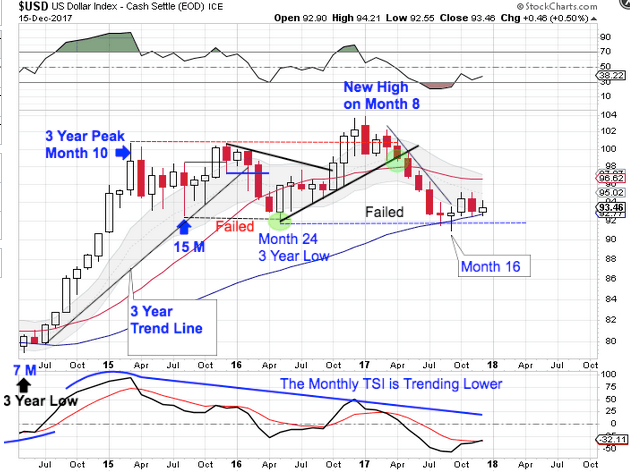
The dollar broke below the previous 3 year cycle low in September to form a failed 3 year cycle. The remaining yearly cycles should now form as left translated yearly cycles until the next 3 year cycle low forms. And with confirmation of a failed 3 year cycle, this sets up as a left translated 3 year cycle. That aligns with our 15 year super cycle analysis.
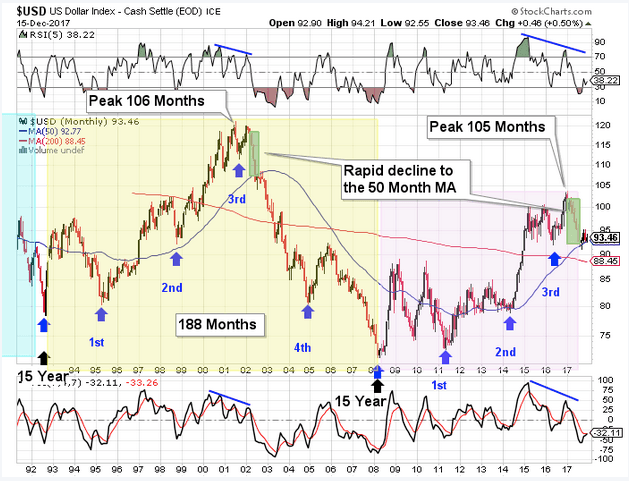
The dollar cycles through a 15 year super cycle. Each 15 year super cycle is embedded with five 3 year cycles. The dollar’s last 15 year super cycle peaked in 2001 on month 106, then declined into its third 3 year cycle low. The topping pattern in 2001 is vary similar to the current set up. The confirmation of a failed 3 year cycle confirms that the dollar has begun its 15 year super cycle decline. Once the dollar began its 15 year super cycle decline back in 2002 there was a rapid decline to the 50 month MA, as the dollar accomplished through September. The 50 month MA has provided support for the formation of a yearly cycle low. Once the new yearly cycle rolls over and the dollar loses the 50 month MA, that will confirm the bear market for the dollar.
May, 2016 hosted the 3 year cycle low, which was a shortened 3 year cycle of only 24 months. Since most times cycle balances themselves out, the dollar is positioned for the current 3 year cycle to be a stretched 3 year cycle to coincide with the start of the 15 year super cycle decline. And a stretched 3 year dollar cycle decline aligns with gold beginning a new multi year bull cycle.
Stocks
Stocks delivered sell signals on Thursday. But breaking to a new high on Friday to negate the daily swing high.
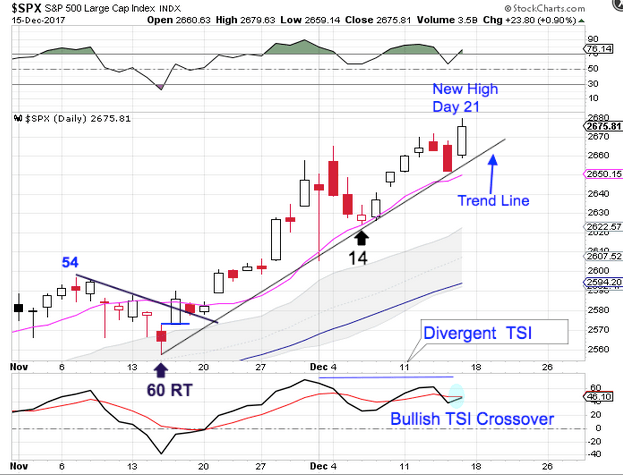
Friday was day 21 for the daily equity cycle. The new high on day 21 locks in a right translated daily cycle formation. It also solidifies the daily cycle trend line. A break below the daily cycle trend line will confirm that stocks have begun its daily cycle decline. Stocks continue to close above the upper daily cycle band indicating a daily uptrend. They will remain in their daily uptrend until they close below the lower daily cycle band.
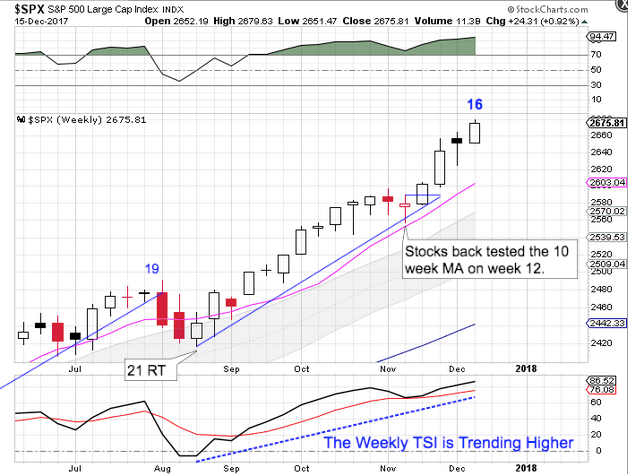
The intermediate cycle continues to develop bullishly. Stocks broke out to a new high this week. The new high on week 16 assures us of a right translated weekly cycle formation. Stocks are in a weekly uptrend. They will remain in their weekly uptrend unless they close below the lower weekly cycle band.
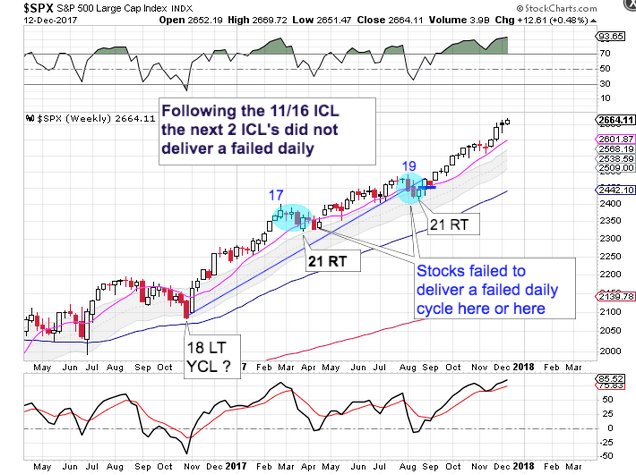
We have previously discussed the change of nature for stocks since emerging from the 11/16 intermediate cycle low. The 2 subsequent intermediate cycle declines following the 11/16 cycle low did not deliver a failed daily cycle. However we did recognize and label then as ICL's.
Looking back I now believe that the 11/16 ICL was also a yearly cycle low. While it did not print a failed weekly cycle, which is what we normally see at a YCL, it otherwise aligns with what we see developing.
Labeling 11/16 as a yearly cycle low aligns with the change of nature that began then. Since then stocks began to close above the upper monthly cycle band to establish a monthly uptrend. The labeling of 11/16 as the yearly cycle low also brings our yearly cycle counts into balance.
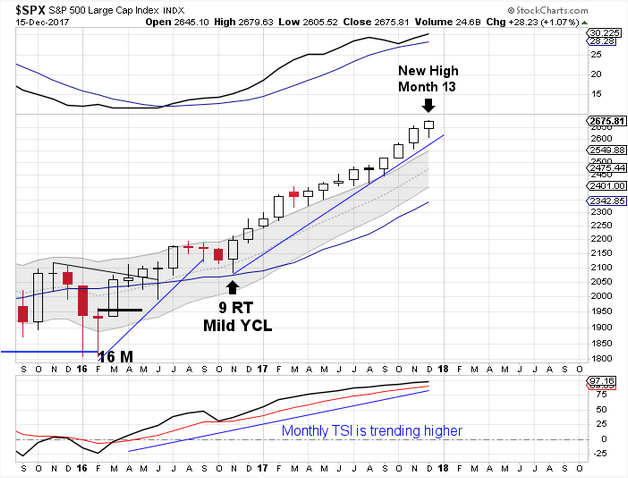
Stocks broke out to another new high in December. December is month 13, placing stocks in their timing band for seeking out their yearly cycle low. Since a yearly cycle low needs to occur at an intermediate cycle low, the earliest a yearly cycle low can form would be at the next intermediate cycle low. This means that the yearly cycle will extend by another 3 - 6 months.
Author

LikesMoney
Independent Analyst
Assets (such as stocks, gold, and the dollar) have identifiable cycles.


