Cycle Trading: The Weekend Report Preview

The Dollar
The dollar printed a bullish reversal on Friday.
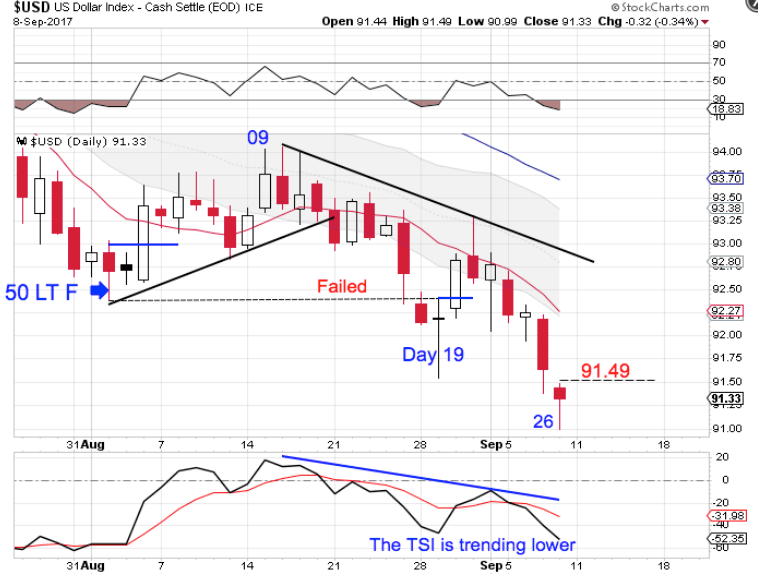
Friday was day 26 for the dollar's daily cycle. That places the dollar in the early part of its timing band to print a daily cycle low. Friday's bullish reversal eases the parameters for forming a swing low. A break above 91.49 forms a swing low. Then a close above the 10 day MA will signal the daily cycle cycle. The dollar continues to close below the lower daily cycle band indicating a daily downtrend. It will remain in its downtrend until it can close above the upper daily cycle band.
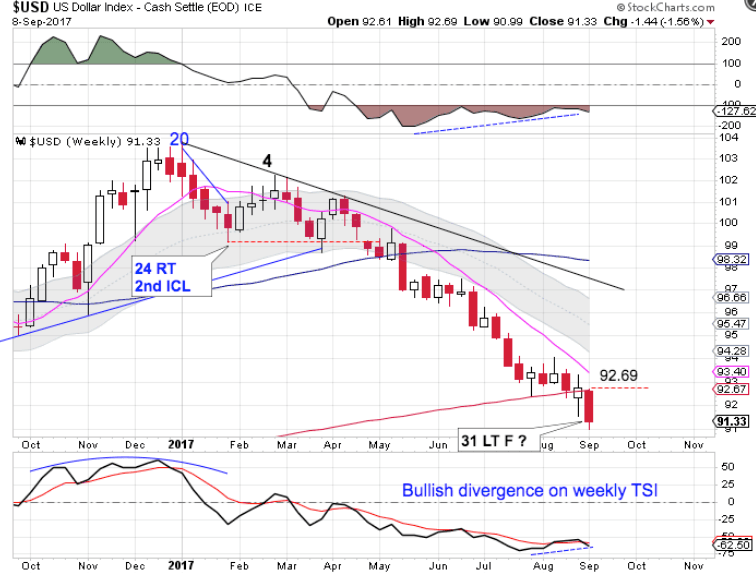
The dollar printed another lower low. At 31 weeks the dollar is late in its timing band to form an ICL. A weekly swing low and a break above the declining 10 week MA will confirm the new intermediate cycle. A break above 92.69 will form a weekly swing low. The dollar is in a weekly downtrend and will continue in its weekly downtrend until it closes above the upper weekly cycle band.
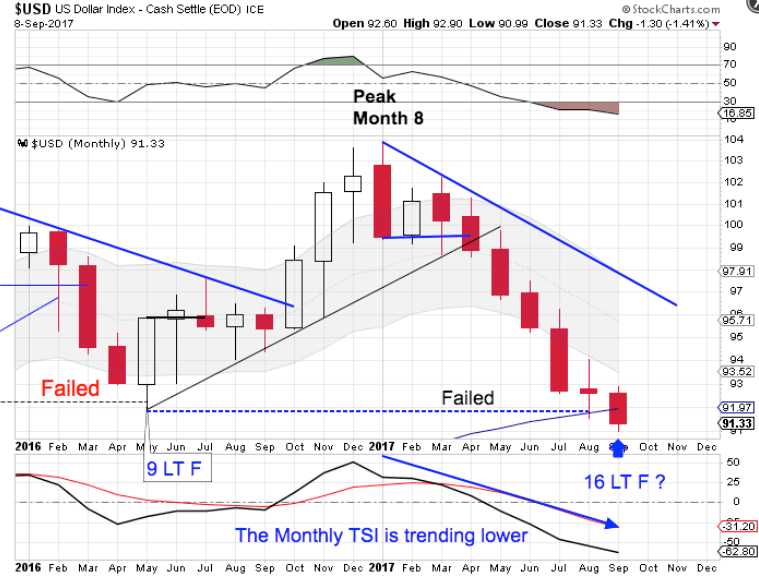
The dollar broke below the previous yearly cycle low in August, forming a failed yearly cycle. And the dollar has printed another lower low in September. At 16 months, the dollar late in its timing band for a yearly cycle low. The dollar needs to form a monthly swing low to signal a new yearly cycle. The earliest a monthly swing low can form will be in October. The dollar has establish a monthly downtrend. It will continue in its monthly downtrend until it closes above the upper monthly cycle band.
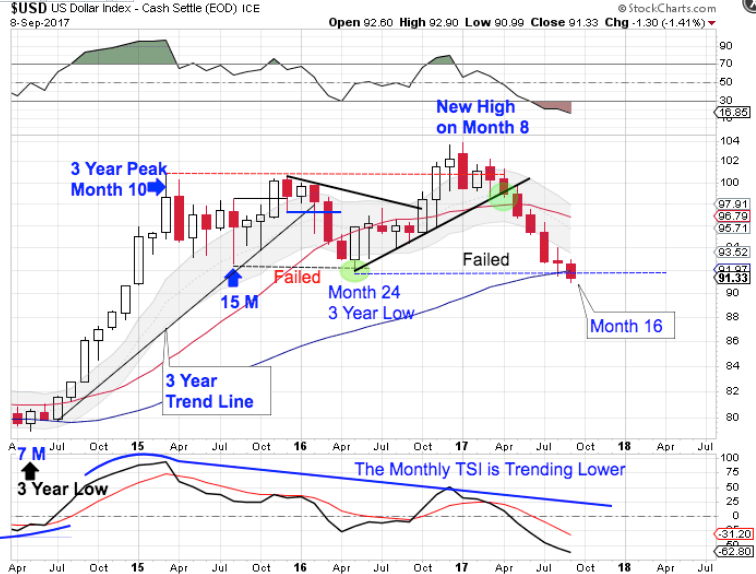
The dollar printed a failed yearly cycle low in May, 2016 to confirm the 3 year cycle decline. Then the dollar went on to printed a higher monthly high. Since a cycle cannot fail and then print a higher high, this confirms that May, 2016 was an early 3 year cycle low. That makes September, 2017 month 16 for the new 3 year cycle.
Now the dollar has broke below the previous 3 year cycle low. This forms a failed 3 year cycle. The remaining yearly cycles should now form as left translated yearly cycles until the 3 year cycle low forms. And with confirmation of a failed 3 year cycle, this sets up as a left translated 3 year cycle. That aligns with our 15 year super cycle analysis.
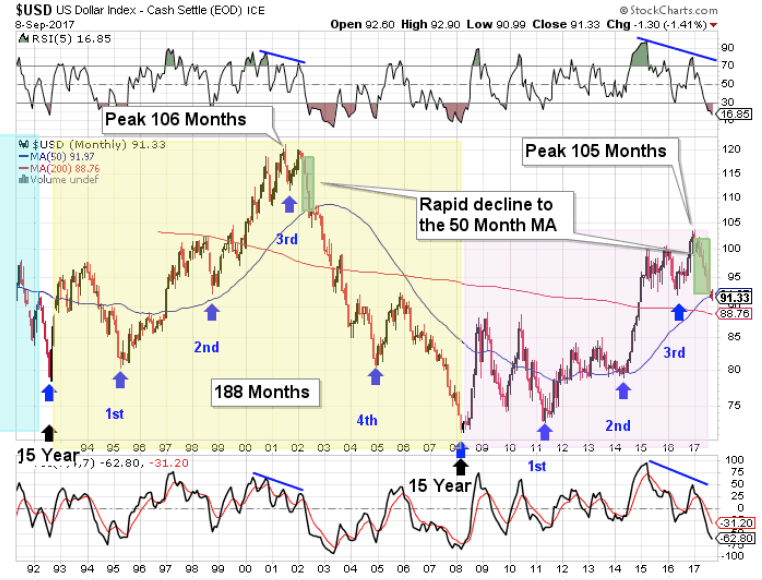
The dollar cycles through a 15 year super cycle. Each 15 year super cycle is embedded with five 3 year cycles. The dollar’s last 15 year super cycle peaked in 2001 on month 106, then declined into its third 3 year cycle low. The topping pattern in 2001 is vary similar to the current set up. The confirmation of a failed 3 year cycle confirms that the dollar has begun its 15 year super cycle decline. Once the dollar began its 15 year super cycle decline back in 2002 there was a rapid decline to the 50 month MA, as the dollar is currently doing.
May, 2016 hosted the 3 year cycle low, which was a shortened 3 year cycle of only 24 months. Since most times cycle balances themselves out, the dollar is positioned for the current 3 year cycle to be a stretched 3 year cycle to coincide with the start of the 15 year super cycle decline. And a stretched 3 year dollar cycle decline aligns with gold beginning a new multi year bull cycle.
Stocks
Stocks have confirmed the new daily cycle but the status of the intermediate cycle remains unclear.
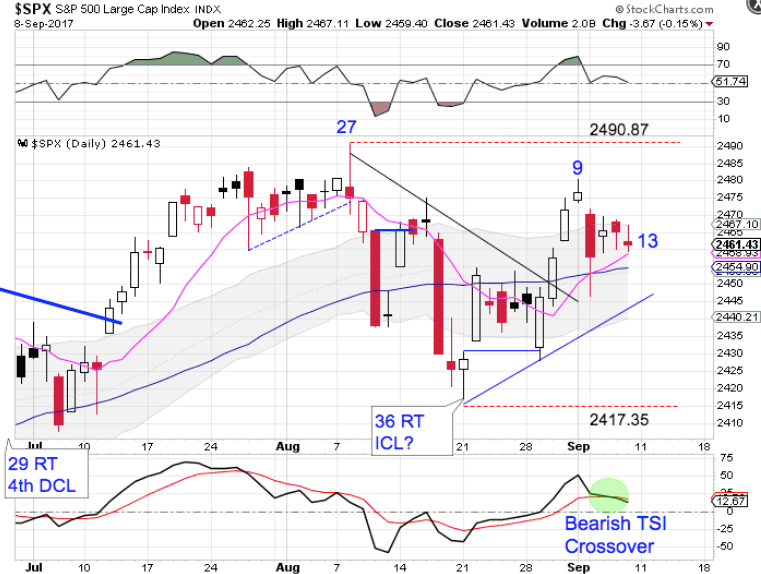
The rally into the day 9 high caused stocks to get stretched above the 10 day MA. Stocks consolidated this week to allow the 10 day MA to catch up to price. If stocks close below both the 10 day MA and the 50 day MA that would be a clear signal that stocks have not completed its intermediate cycle decline. But a break above the previous daily cycle high of 2490.87 shifts the odds towards 8/21 being the ICL. Stocks are in a daily uptrend. They will continue in its uptrend unless they close back below the lower daily cycle band.
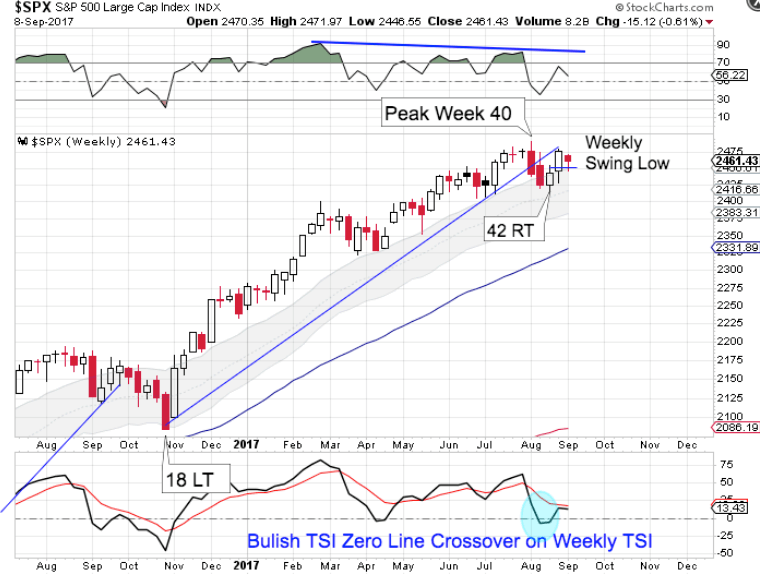
Stocks did not print a failed daily cycle leading into the week 42 low. However, all other indicators point to an intermediate cycle low being set. Stocks continue to be in a weekly uptrend and will remain so until they close below the lower weekly cycle band.
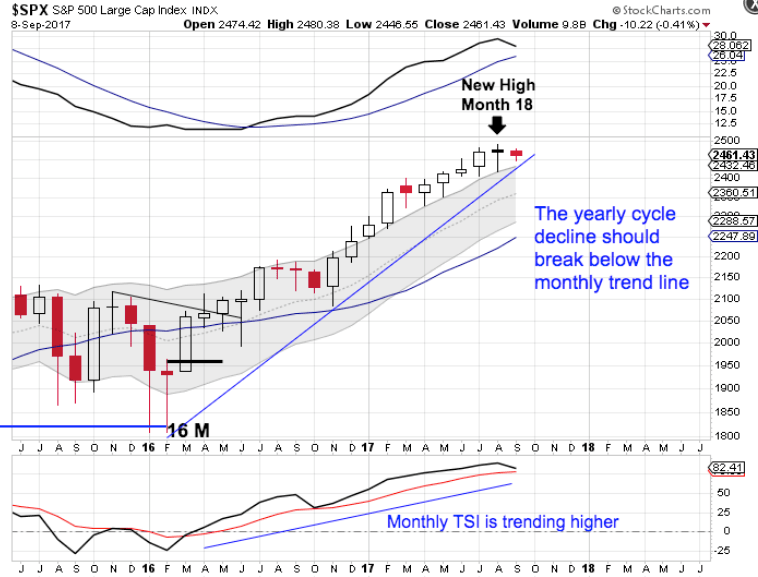
Stocks broke out to a new high in August locking in a right translated yearly cycle formation. Stocks are deep in their timing band for seeking out their yearly cycle low. Since stocks printed a new high in August, the earliest a monthly swing high can form will be in September. A monthly swing high accompanied by a break of the monthly trend line will confirm the yearly cycle decline. If, in fact, a new intermediate cycle has just begun, the earliest a yearly cycle low can form would be at the next intermediate cycle low, which extend the yearly cycle by another 4 - 6 months.
Author

LikesMoney
Independent Analyst
Assets (such as stocks, gold, and the dollar) have identifiable cycles.


