Cycle Trading: The Weekend Report Preview

The Dollar
After peaking on day 10, the dollar printed its lowest point on Tuesday, day 28, placing the dollar in its timing band for a daily cycle low. The dollar formed a daily swing low on Wednesday, closing above the 200 day MA to confirm the new daily cycle.
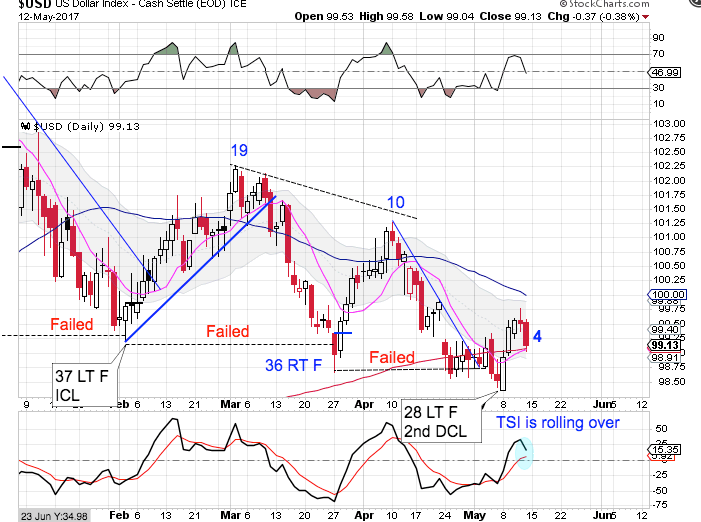
The dollar is in a daily downtrend and will continue in its daily downtrend until it closes above the upper daily cycle band. Our intermediate cycle count is at 14 weeks, so our expectation is to see another left translated, failed daily cycle before the intermediate cycle low prints. The daily swing high that formed of Friday aligns with that expectation. A close back below the 200 day MA will signal that the dollar is declining into its daily cycle low and continuing its intermediate cycle decline.
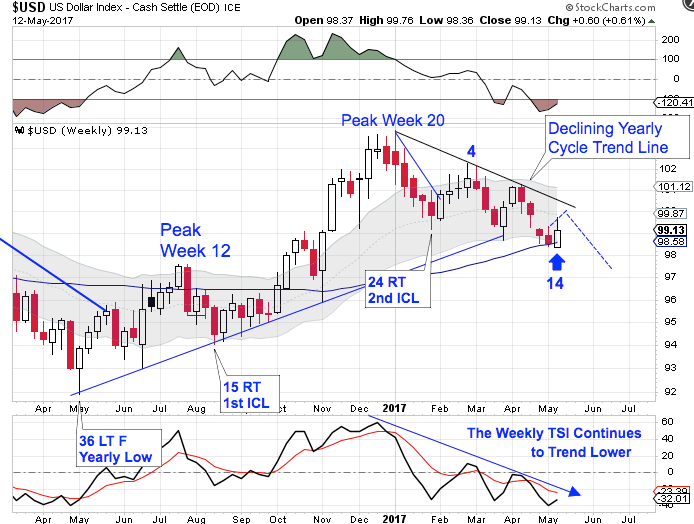
This was week 14 for the intermediate dollar cycle. The dollar received support from the 50 week MA to begin a new daily cycle. If the dollar breaks above the declining weekly trend line then we would need to label week 14 as an early weekly cycle low. But since 14 weeks is too early for an ICL, we are expecting to see the dollar be rejected by the declining weekly trend line and continue its intermediate cycle decline.
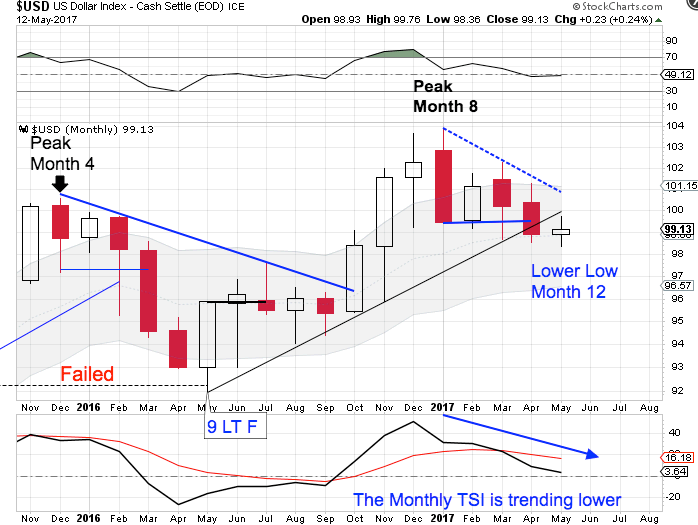
The dollar has printed its lowest point in May, following the month 8 peak. May is month 12, placing the dollar in its timing band to print a yearly cycle low. The yearly cycle low will likely arrive when the dollar completes its intermediate cycle decline.
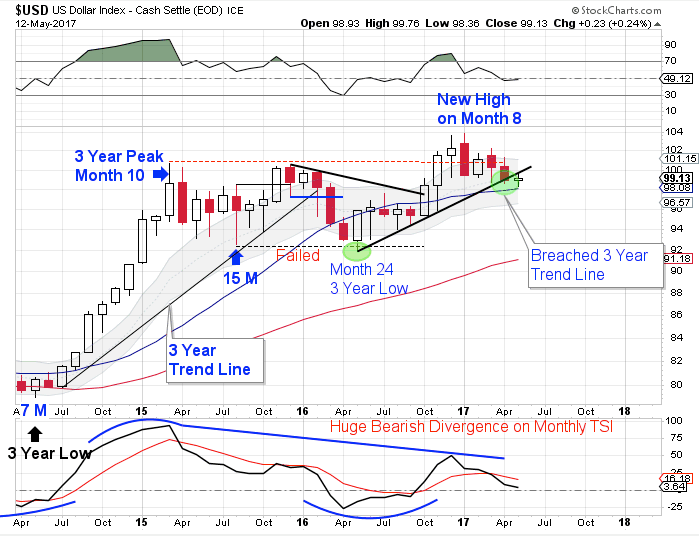
The dollar printed a failed yearly cycle in May, 2016 to confirm the 3 year cycle decline. Then the dollar went on to printed a higher monthly high. Since a cycle cannot fail and then print a higher high, this confirms that May, 2016 was an early 3 year cycle low. That makes May, 2017 month 12 for the new 3 year cycle. The dollar has now breached the 3 year trend line. This indicates that the dollar has begun its 3 year cycle decline. If that is the case then the subsequent yearly cycles should form as left translated yearly cycles until the 3 year cycle low forms. And if the 3 year cycle decline has begun, then it is setting up as a left translated 3 year cycle. That aligns with our 15 year super cycle analysis.
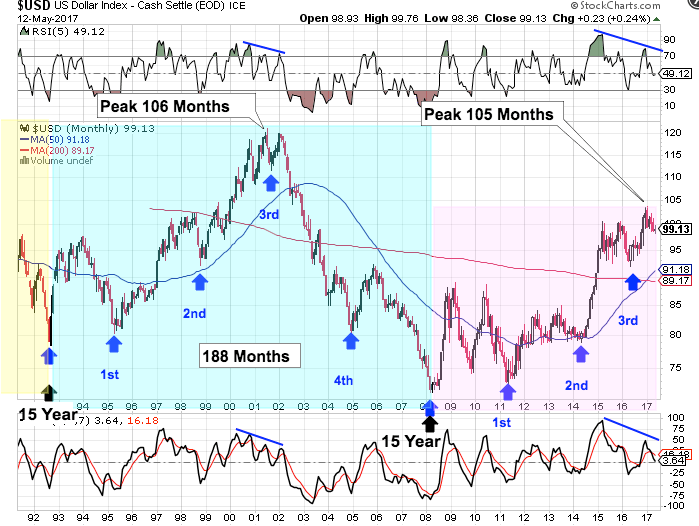
The dollar cycles through a 15 year super cycle. Each 15 year super cycle is embedded with five 3 year cycles. The dollar’s last 15 year super cycle peaked in 2001 on month 106, then declined into its third 3 year cycle low. There are some similarities developing to the current set up. Currently, the dollar has printed a new high in January, which is month 105 for the 15 year super cycle. Which is about when the previous super cycle rolled over into its 15 year super cycle decline. At the previous super cycle peak the dollar was quite stretched above the 200 month MA as well as the 50 month MA — as it is right now. There are bearish divergences developing on the momentum indicators that also appeared at the previous 15 year super cycle peak.
May, 2016 hosted the 3 year cycle low, which was a shortened 3 year cycle of only 24 months. Since most times cycle balances themselves out, we could be poised for the next 3 year cycle to be a stretched 3 year cycle just as the dollar is ready to begin its 15 year super cycle decline. And a stretched 3 year dollar cycle decline would align with gold beginning a new multi year bull cycle.
Stocks
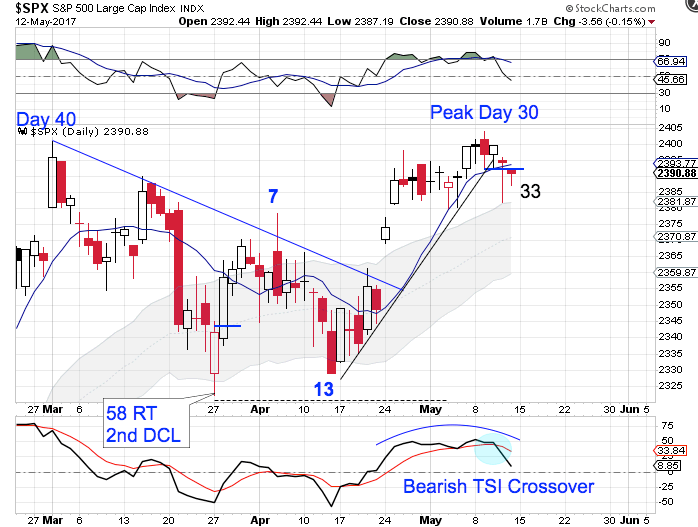
Friday was day 33 for the daily equity cycle, placing stocks in their timing band for a daily cycle low. Once a daily swing low forms, it has good odds of marking the DCL. Stocks are in a daily uptrend and will remain so until they close below the lower daily cycle band.
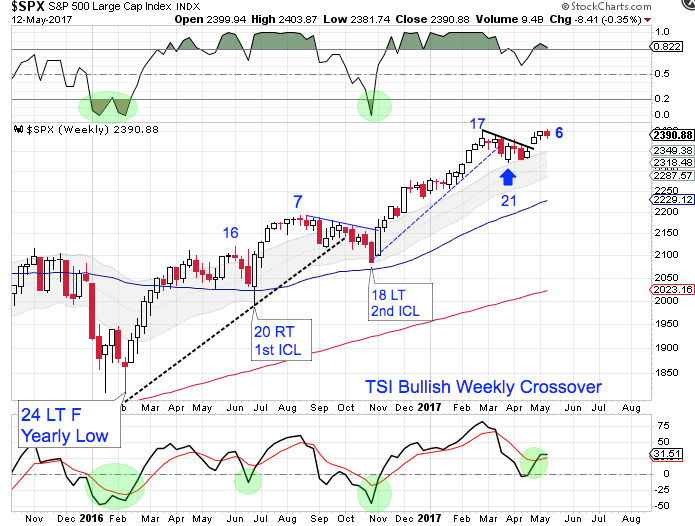
Stocks peaked on week 17 then proceed to decline into its intermediate cycle low. Stocks printed its lowest point on week 21 and then broke above the declining weekly trend line 3 weeks ago to make it look like stocks are in a new weekly cycle.
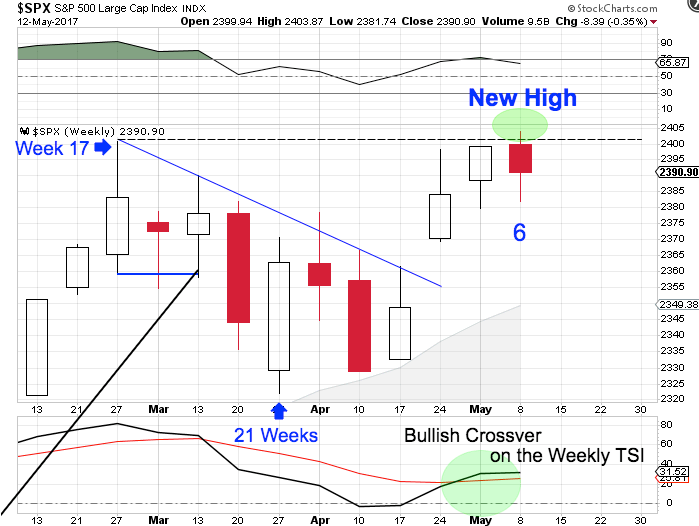
Stocks have not printed a failed daily cycle during the intermediate cycle decline. This absence of a failed daily cycle makes me hesitant to label week 21 as the intermediate cycle low. Stocks broke out to a new weekly high this week. I would like to see a clear and convincing break above the previous weekly high before labeling week 21 as the ICL. Stocks are in a weekly uptrend and will remain in its weekly uptrend unless they close below the lower weekly cycle band.
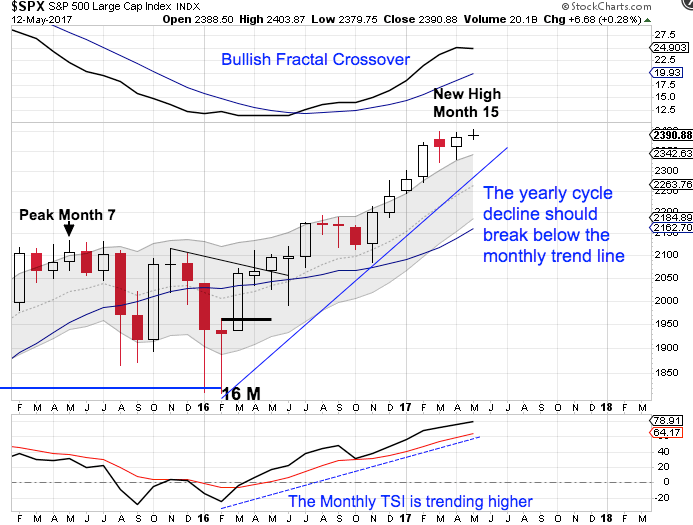
May is month 15 for the yearly equity cycle. The new high locks in a right translated yearly cycle formation. Stocks are now in their timing band for seeking out their yearly cycle low. A monthly swing high accompanied by a break of the monthly trend line will confirm the yearly cycle decline. Since stocks printed a higher high in May, the earliest a monthly swing high can form will be in June.
Author

LikesMoney
Independent Analyst
Assets (such as stocks, gold, and the dollar) have identifiable cycles.


