Cycle Trading: The 4/13/17 Weekend Report Preview

The Dollar
The dollar formed a swing high and then closed below both the 50 day MA and the 10 day MA to signal that the daily cycle is in decline.
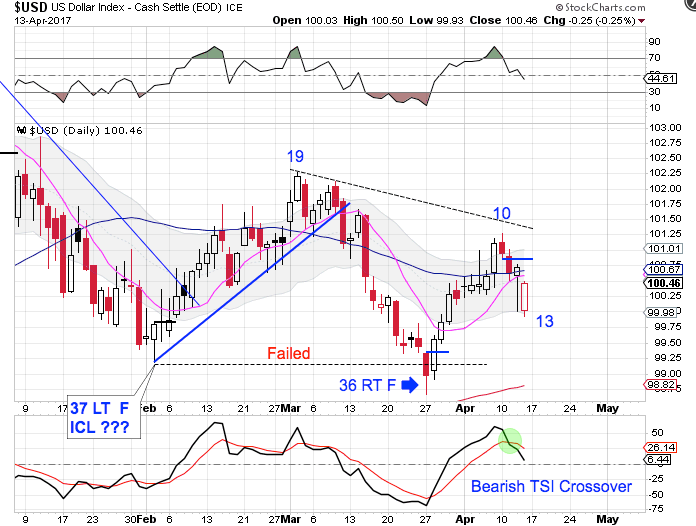
Friday was day 13 for the daily dollar cycle. The previous 7 daily cycles have averaged 33 days. So with a peak on day 10, this daily cycle is likely to form as a left translated daily cycle and continue the pattern of lower highs and lower lows.
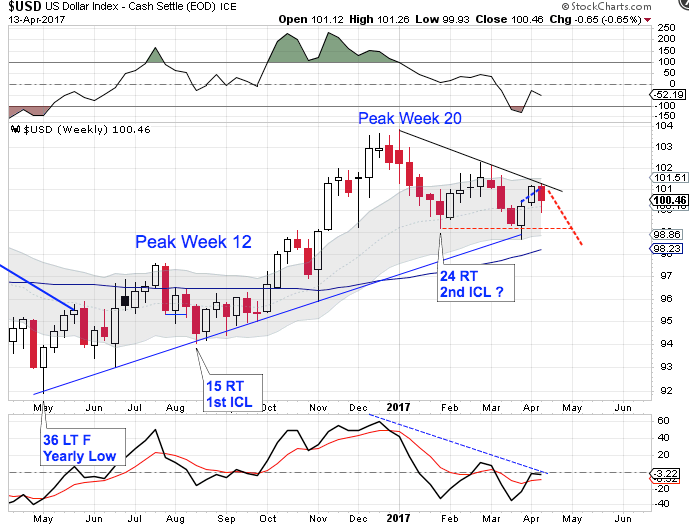
In real time week 24 looked like an intermediate cycle low. There was a 6 week decline into the week 24 low. The ensuing daily cycle did form as a right translated daily cycle, which is our cyclical expectation following an ICL. But then that daily cycle failed, which would indicate a continuation of the intermediate cycle decline. But the current daily cycle is also threatening to form as a left translated, failed daily cycle. That has me thinking that the ICL did print on week 24. The dollar was rejected by the declining weekly trend line this past week. Bearish follow through will help to confirm that week 24 did host the ICL. On the other hand, if the dollar breaks above the upper weekly cycle band, then we would need to label the March low as the ICL which would make this past week - week 2.
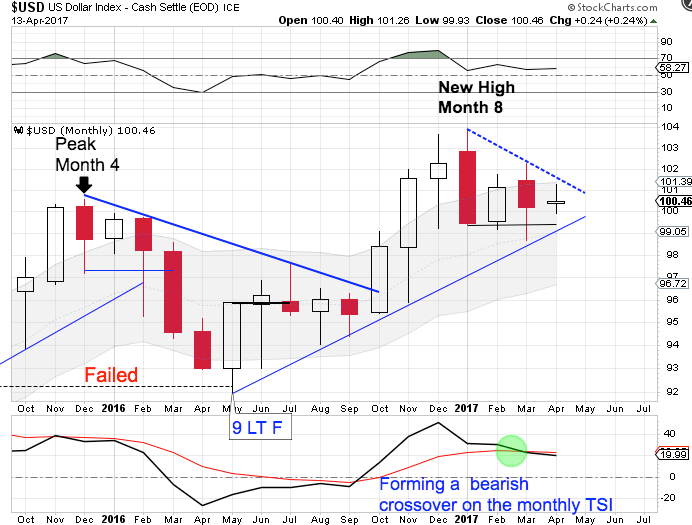
The dollar's yearly cycle peaked in January, month 8. The dollar has formed a monthly swing high and is in its timing band to print a yearly cycle low. The dollar should break below the monthly trend line in order to complete its yearly cycle decline.
The dollar printed a failed yearly cycle in May to confirm the 3 year cycle decline. The dollar has since printed new monthly highs. Since a cycle cannot fail and then print a higher high, this confirms that May was an early 3 year cycle low. That makes April month 11 for the new 3 year cycle.
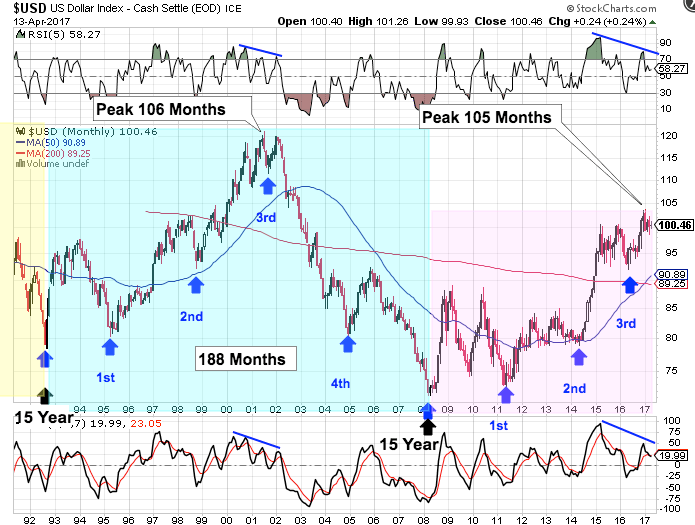
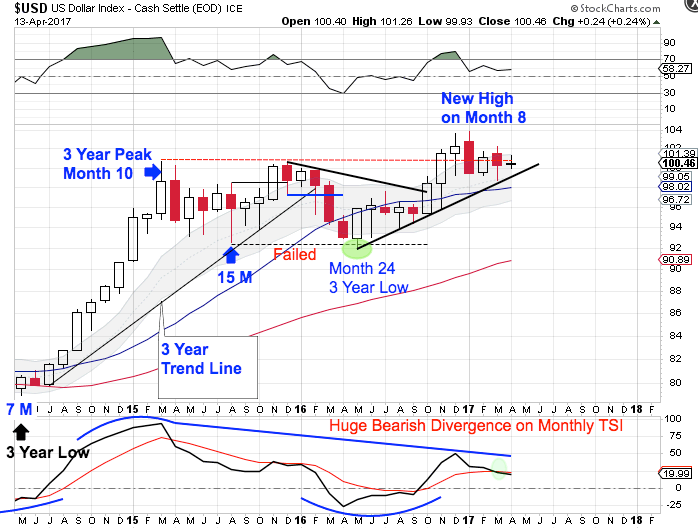
The dollar cycles through a 15 year super cycle. Each 15 year super cycle is embedded with five 3 year cycles. The dollar’s last 15 year super cycle peaked in 2001 on month 106, then declined into its third 3 year cycle low. There are some similarities developing to the current set up. Currently, the dollar has printed a new high in January, which is month 105 for the 15 year super cycle. Which is about when the previous super cycle rolled over into its 15 year super cycle decline. At the previous super cycle peak the dollar was quite stretched above the 200 month MA as well as the 50 month MA — as it is right now. There are bearish divergences developing on the momentum indicators that also appeared at the previous 15 year super cycle peak.
May hosted the 3 year cycle low, which was a shortened 3 year cycle of only 24 months. Since most times cycle balances themselves out, we could be poised for the next 3 year cycle to be a stretched 3 year cycle just as the dollar is ready to begin its 15 year super cycle decline. And a stretched 3 year dollar cycle decline would align with gold beginning a new multi year bull cycle.
Stocks
Stocks closed below the lower daily cycle band on Friday to indicate that stocks are declining into their daily cycle low.
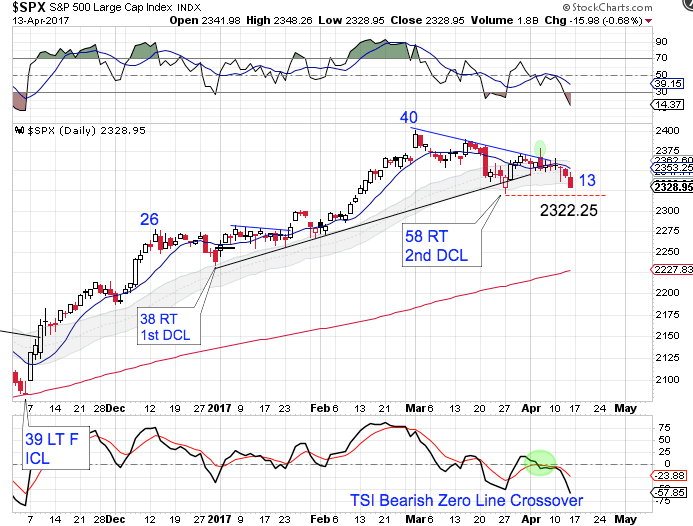
Closing below the lower daily cycle band signals an end to the daily uptrend. It is also a reliable indicator that the intermediate cycle is in decline. The peak on day 7 locks in a left translated daily cycle formation. A break below 2322.25 would form a failed daily cycle and confirm the intermediate cycle is in decline. And something to keep in mind is that the previous daily cycle was stretched at 58 days. Since cycles tend to balance a stretched cycle with a shortened cycle, we could see a shortened daily cycle here with stocks possibly printing a DCL next week.
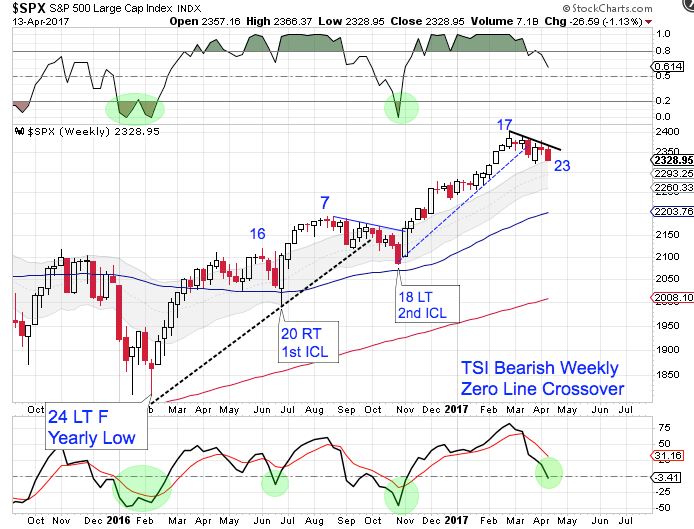
Stocks peaked on week 17. They have formed a weekly swing high and broke below the weekly trend line to signal the intermediate cycle is in decline. Stocks will need to break below the week 21 low of 2322.25 in order to complete their intermediate cycle decline. But stocks are now at week 23, placing them in their timing band to form an intermediate cycle low. A weekly swing low and break of the declining weekly trend line will confirm a new intermediate cycle.
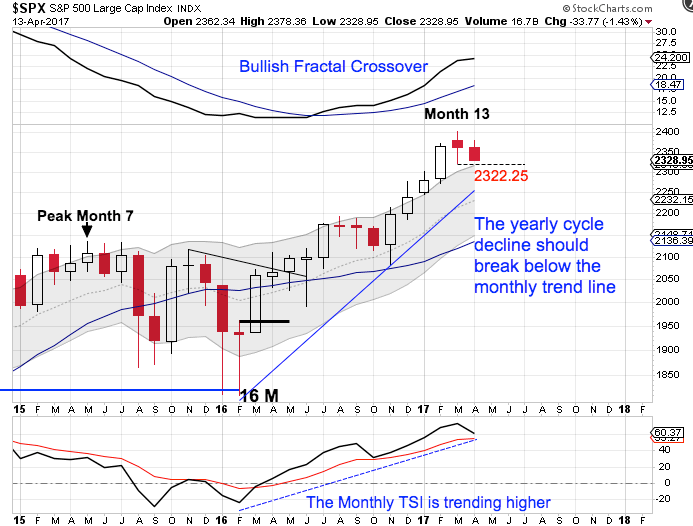
March is month 13 for the yearly equity cycle. The new high in March locks in a right translated yearly cycle formation. Stocks are now in their timing band for seeking out their yearly cycle low. A monthly swing high accompanied by a break of the monthly trend line will confirm the yearly cycle decline. Once stocks form a failed daily cycle that should trigger the yearly cycle decline. A break below the previous DCL of 2322.25 forms a failed daily cycle.
Author

LikesMoney
Independent Analyst
Assets (such as stocks, gold, and the dollar) have identifiable cycles.


