Cycle Trading: The 4/07/17 Weekend Report Preview

The Dollar
The new high on Friday, day 9, begins to shift the likelihood towards a right translated daily cycle formation.
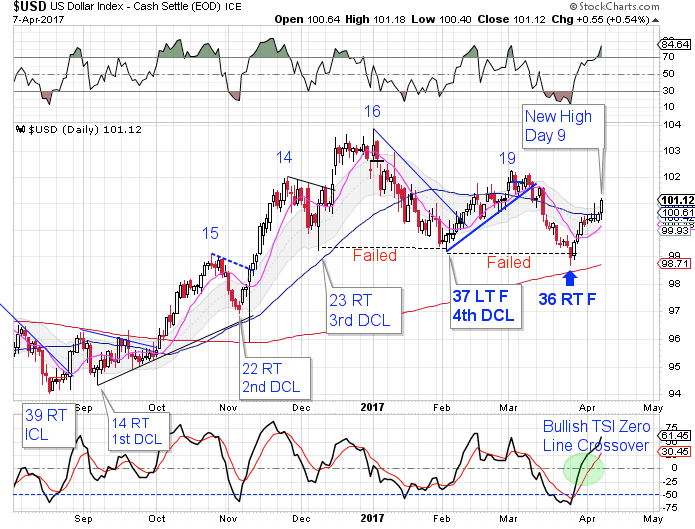
The dollar broke convincingly higher on Friday. The dollar closed above the upper daily cycle band which signals an end to the daily downtrend and indicates that 3/27/17 hosted the ICL.
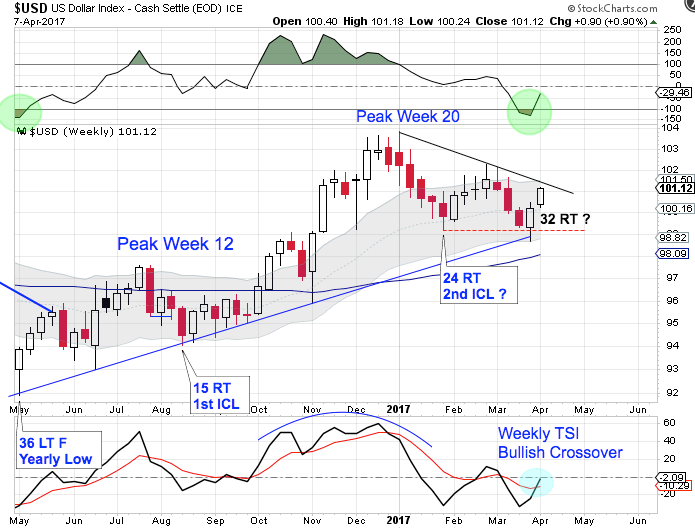
Evidence is accumulating in favor of week 32 hosting the ICL. First off consecutive failed daly cycles indicates that the intermediate cycle was stretched out to week 32. The weekly RSI did not become oversold until week 32. Still we need to see the dollar break above the declining weekly trend line for confirmation. Rejection by the declining weekly trend line would indicate that week 24 did host the ICL.
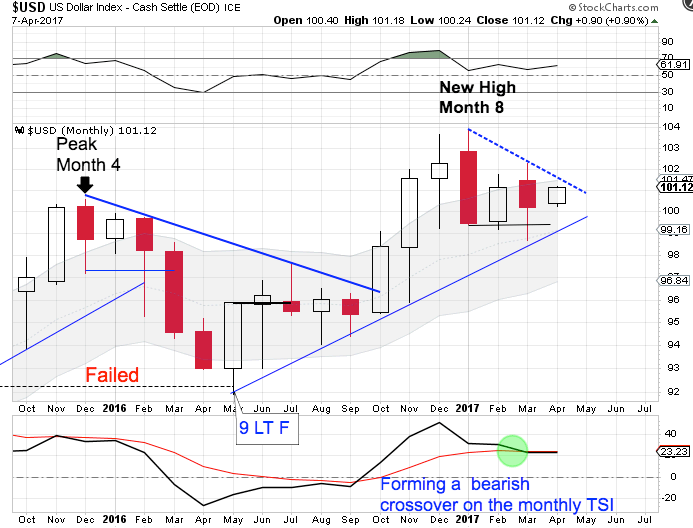
The dollar's yearly cycle peaked in January, month 8. The dollar has formed a monthly swing high and is in its timing band to print a yearly cycle low. The dollar should break below the monthly trend line in order to complete its yearly cycle decline.
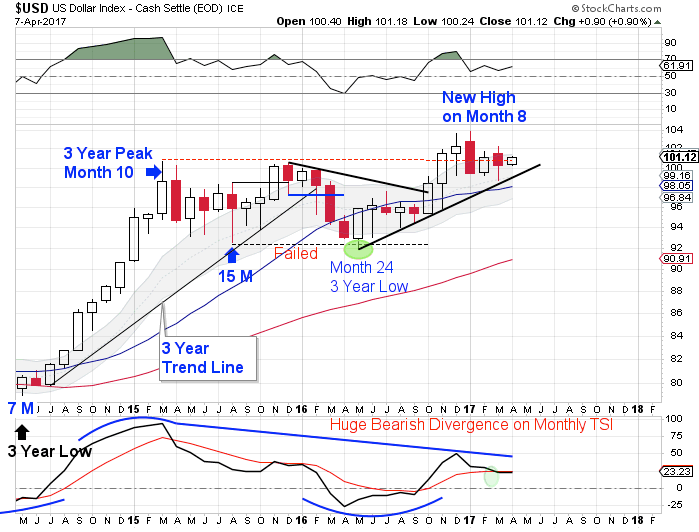
The dollar printed a failed yearly cycle in May to confirm the 3 year cycle decline. The dollar has since printed new monthly highs. Since a cycle cannot fail and then print a higher high, this confirms that May was an early 3 year cycle low. That makes April month 11 for the new 3 year cycle.
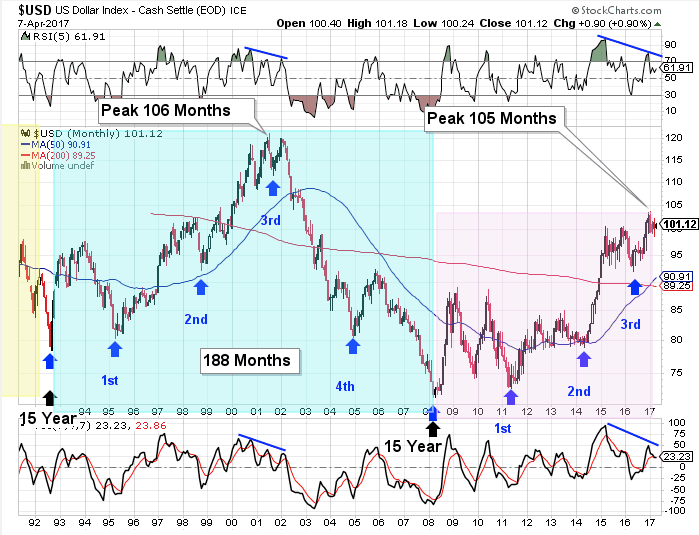
The dollar cycles through a 15 year super cycle. Each 15 year super cycle is embedded with five 3 year cycles. The dollar's last 15 year super cycle peaked in 2001 on month 106, then declined into its third 3 year cycle low. There are some similarities developing to the current set up. Currently, the dollar has printed a new high in January, which is month 105 for the 15 year super cycle. Which is about when the previous super cycle rolled over into its 15 year super cycle decline. At the previous super cycle peak the dollar was quite stretched above the 200 month MA as well as the 50 month MA — as it is right now. There are bearish divergences developing on the momentum indicators that also appeared at the previous 15 year super cycle peak.
May hosted the 3 year cycle low, which was a shortened 3 year cycle of only 24 months. Since most times cycle balances themselves out, we could be poised for the next 3 year cycle to be a stretched 3 year cycle just as the dollar is ready to begin its 15 year super cycle decline. And a stretched 3 year dollar cycle decline would align with gold beginning a new multi year bull cycle.
Stocks
Stocks broke above the declining trend line this week to signal that day 58 hosted the DCL.
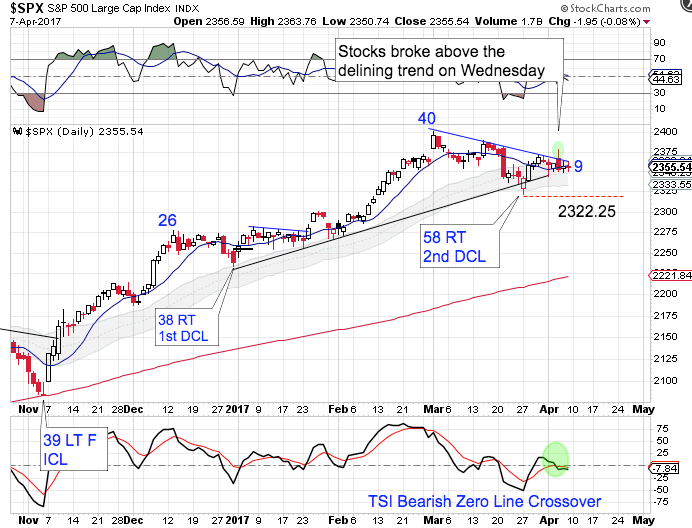
So far the rally out of the day 58 DCL has been weak. The bearish reversal on Wednesday, day 7, sets up the potential for an extremely left translated daily cycle formation. This is the 3rd daily cycle for the current intermediate cycle. We are watching for a left translated daily cycle formation to set up a decline into the ICL. A break below 2322.25 forms a failed daily cycle and confirms the intermediate cycle decline. But there were two strong BOW days this week that signals that stocks will make one more push higher. A possible scenario would be a break higher to get everybody "on the wrong side of the boat". Followed by the final decline into the ICL.
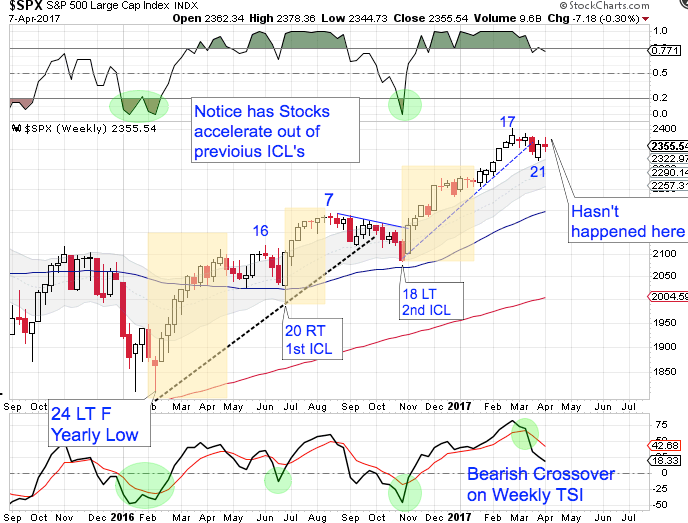
Stocks peaked on week 17. They have formed a weekly swing high and broke below the weekly trend line to signal the intermediate cycle is in decline. But stocks have now formed a weekly swing low this past week. A low on week 21 does place stocks in their timing band for an ICL. However the rally out of the week 21 low does not resemble other rallies out of intermediate cycle lows. Normally stocks accelerate out of ICL's, which has not happened here. So I remain skeptical that week 21 hosted an ICL. But if stocks go on to break above the week 17 high of 2400.98 then we will be forced to acknowledge that week 21 hosted the ICL.
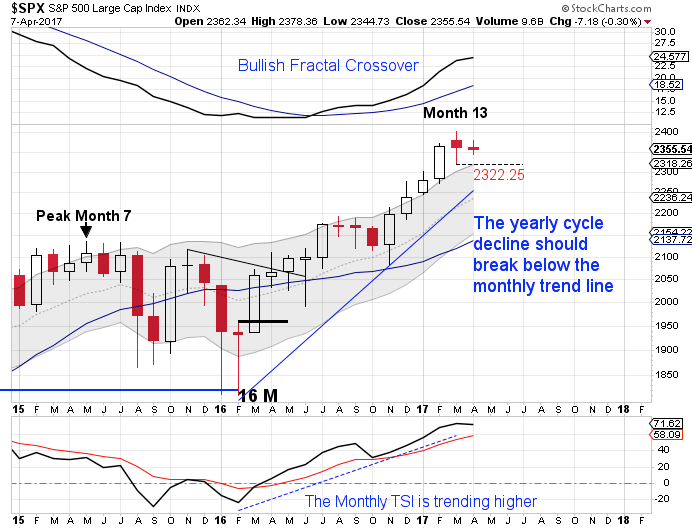
March is month 13 for the yearly equity cycle. The new high in March locks in a right translated yearly cycle formation. Stocks are now in their timing band for seeking out their yearly cycle low. A monthly swing high accompanied by a break of the monthly trend line will confirm the yearly cycle decline. Once stocks form a failed daily cycle that should trigger the yearly cycle decline. A break below the previous DCL of 2322.25 forms a failed daily cycle.
Author

LikesMoney
Independent Analyst
Assets (such as stocks, gold, and the dollar) have identifiable cycles.


