Cycle Trading: The 2/24/17 Weekend Report Preview

The Dollar
Friday was day 15, placing the dollar 3 days shy of entering its timing band for a daily cycle low. While the dollar breached the daily cycle trend line, it did not deliver a clear and convincing break below the daily cycle trend line nor did it close below the 10 day MA.
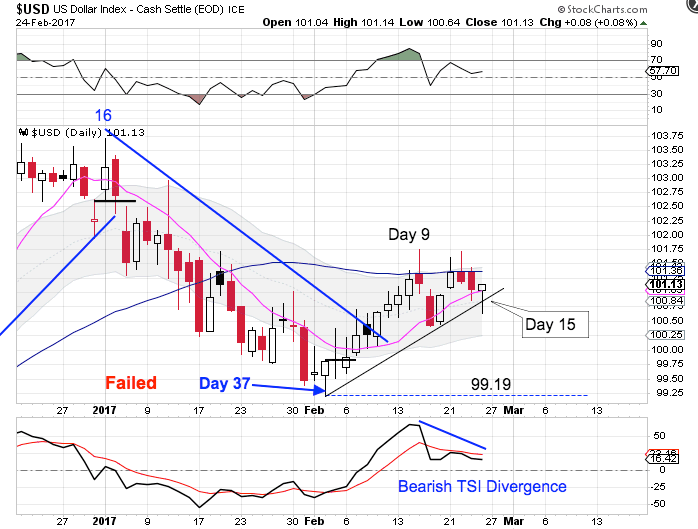
Day 9 remains as the daily cycle peak, which favors a left translated cycle formation. The dollar needs to break convincingly below the daily cycle trend line to confirm the daily cycle decline. The dollar still is in a daily downtrend. Therefore once the dollar breaks below the daily cycle trend line that should lead to the dollar breaking below the previous daily cycle low of 99.19 to form another failed daily cycle.
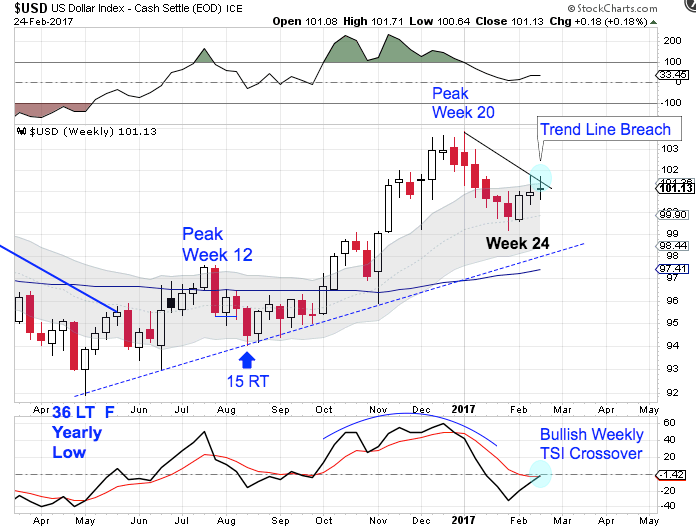
The dollar printed its lowest point on week 24 following the week 20 peak. At 24 weeks that places the dollar in its timing band for an intermediate cycle low. The dollar has formed a weekly swing low off the week 24 low. If the dollar's daily cycle continues its daily cycle decline next week then that would make this week 27 for the dollar's intermediate cycle. The dollar should break below the weekly trend line in order to complete its intermediate cycle decline.
However, if the dollar manages to rally next week that would cause the daily cycle to shift to a right translated daily cycle formation. A right translated daily cycle formation would indicate that week 24 hosted the intermediate cycle low. Such a scenario would cause a cyclical anomaly because that would mean that the dollar did not deliver a weekly trend line break to confirm the intermediate cycle decline. Setting that aside, there would be bullish implications for gold.
If week 24 did host the intermediate cycle low, that would make this week 3 for a new intermediate dollar cycle. With the dollar in its timing band for a yearly cycle low that would set up the expectation for a left translated weekly cycle formation for the new intermediate cycle.
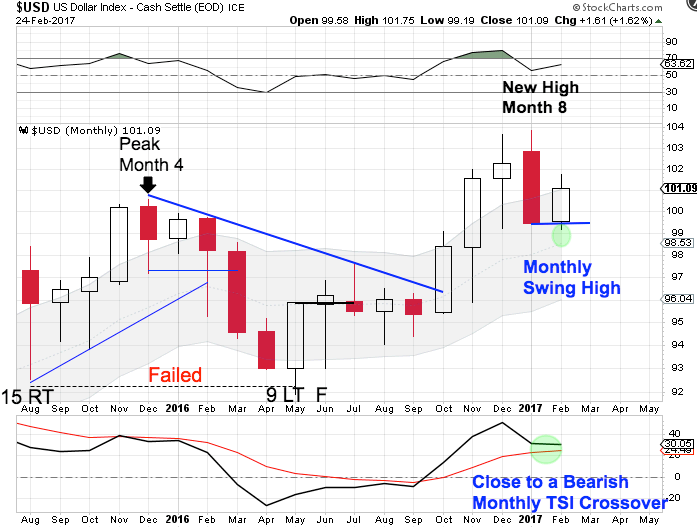
The dollar has formed a monthly swing high to signal the start of the yearly cycle decline. A high on month 8 assures us of a right translated yearly cycle formation. Following a failed yearly cycle, if the dollar is still declining into its 3 year cycle low then the dollar should continue to form left translated, failed yearly cycles. The right translated yearly cycle formation indicates that May hosted the 3 year cycle low.
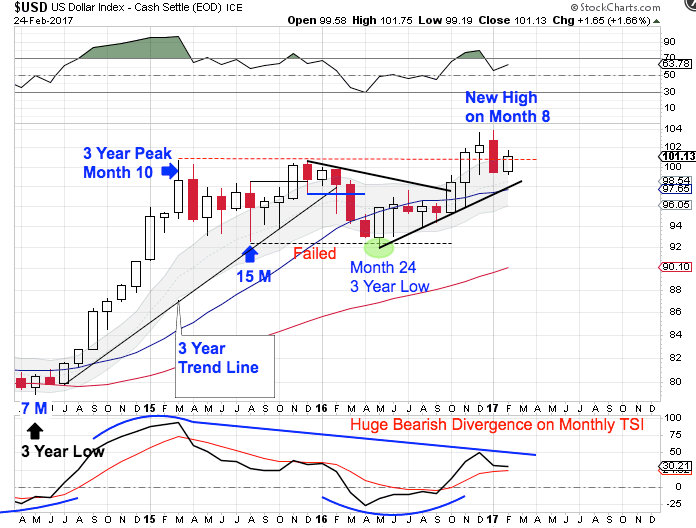
Printing a failed yearly cycle in May confirmed the 3 year cycle decline for the dollar. The dollar has now gone on to print a higher monthly high. Since a cycle cannot fail and then print a higher high, this confirms that May was an early 3 year cycle low. That makes February month 9 for the new 3 year cycle.
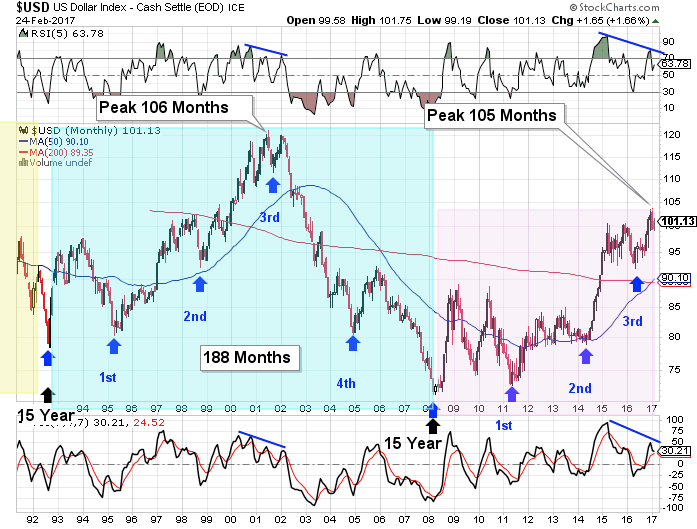
The dollar cycles through a 15 year super cycle. Each 15 year super cycle is embedded with five 3 year cycles. The dollar’s last 15 year super cycle peaked in 2001 on month 106, then declined into its third 3 year cycle low. There are some similarities developing to the current set up. Currently, the dollar has printed a new high in January, which is month 105 for the 15 year super cycle. Which is about when the previous super cycle rolled over into its 15 year super cycle decline. At the previous super cycle peak the dollar was quite stretched above the 200 month MA as well as the 50 month MA — as it is right now. There are bearish divergences developing on the momentum indicators that also appeared at the previous 15 year super cycle peak.
May hosted the 3 year cycle low, which was a shortened 3 year cycle of only 24 months. Since most times cycle balances themselves out, we could be poised for the next 3 year cycle to be a stretched 3 year cycle just as the dollar is ready to begin its 15 year super cycle decline. And a stretched 3 year dollar cycle decline would align with gold beginning a new multi year bull cycle.
Stocks
Friday was day 37 for the daily equity cycle, placing stocks in their timing band to seek out a daily cycle low.
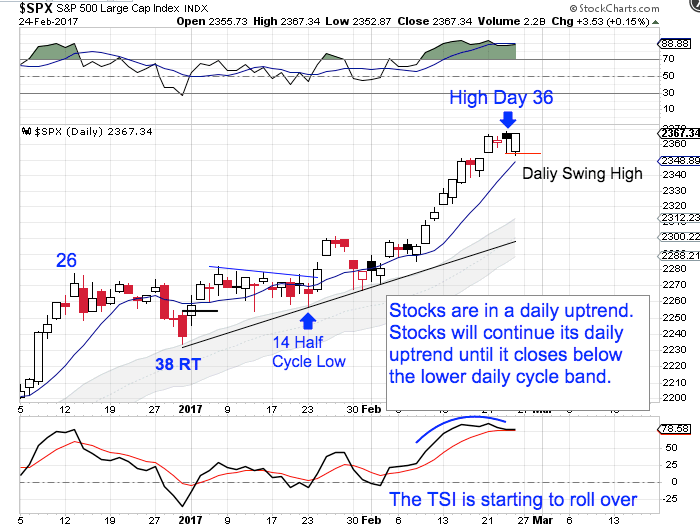
Stocks did form a swing high on Friday but still managed to close higher. A swing high and a loss of the 10 day MA will signal the start of the daily cycle decline. A new high on day 36 locks in a right translated daily cycle formation. Stocks continue to close above the upper daily cycle band maintaining its daily uptrend. Stocks will remain in its daily uptrend unless they close below the lower daily cycle band.
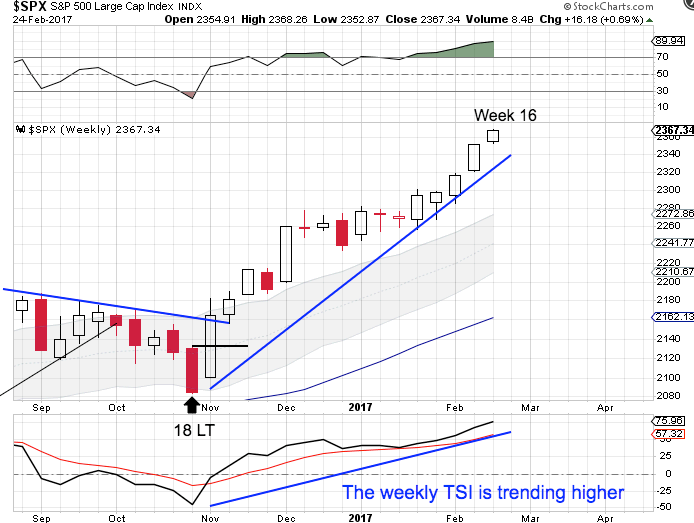
With the assurance of a right translated daily cycle formation stocks will need at least one more daily cycle before competing the current intermediate cycle. That should take the intermediate cycle out to late April or into May. Stocks continue to close above the upper weekly cycle band remaining in its daily uptrend. Stocks will continue its weekly uptrend until it closes below the lower daily cycle band.
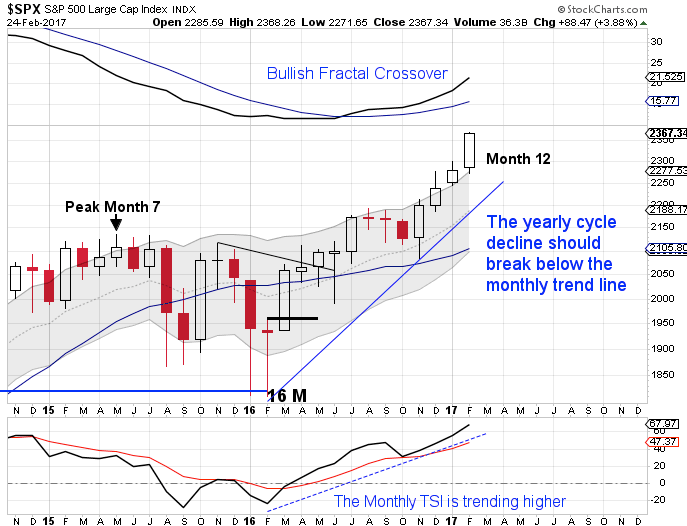
February is month 12 for the yearly equity cycle. The new high locks in a right translated yearly cycle formation. Stocks are now in their timing band for seeking out their yearly cycle low. A monthly swing high accompanied by a break of the monthly trend line will confirm the yearly cycle decline. Once stocks begin their intermediate cycle decline that should also trigger the yearly cycle decline.
Author

LikesMoney
Independent Analyst
Assets (such as stocks, gold, and the dollar) have identifiable cycles.


