Cycle Trading: The 12/08/17 Weekend Report Preview
The Dollar
The dollar broke above the declining trend line on Monday to confirm the new daily cycle.
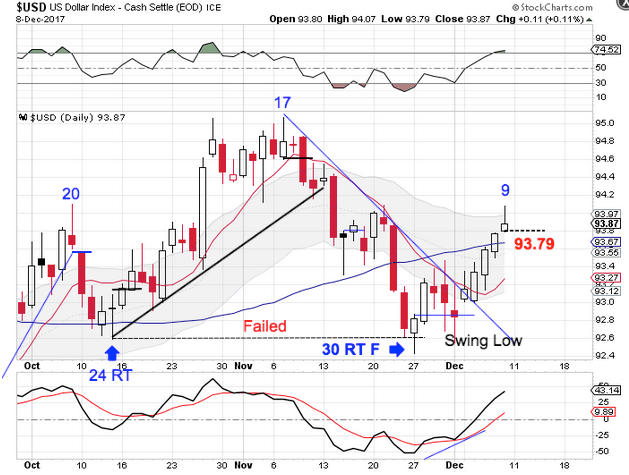
The dollar rallied this week and printed another higher high on Friday, day 9. Keep in mind that the dollar is in a daily downtrend and a bearish reversal formed on Friday. If a swing high forms off Friday's candle then that will prevent the dollar from closing above the upper daily cycle band. By not closing above the upper daily cycle band means that the dollar remains its daily downtrend. A break below 93.79 forms a daily swing high. But if the dollar manages to close above the upper daily cycle band then that would signal that the November DCL also marked an early ICL.
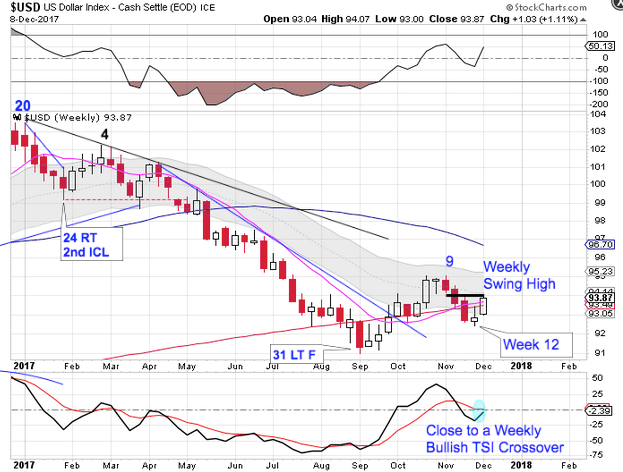
The intermediate dollar cycle peaked on week 9 and formed a weekly swing high on week 10 to begin its intermediate cycle decline. The dollar printed its lowest point on week 12 and has now formed a weekly swing low. 12 weeks is too early to expect an intermediate cycle low. But if the dollar closes above the upper daily cycle band then that indicates that week 12 hosted the ICL. The dollar did regain both the 200 week MA and the 10 week MA, which supports a week 12 ICL scenario. Any bullish follow through this week will force us to label week 12 as an early ICL.
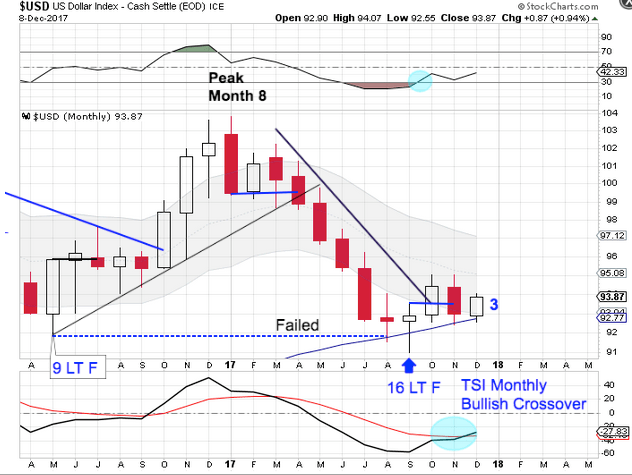
The dollar printed its lowest point in September, month 16. A monthly swing low formed in October along with a break above the declining monthly trend line to confirm the new yearly cycle. The dollar is teetering right on the 50 month MA. A close below the 50 month MA will signal that the yearly cycle decline has begun. The dollar is in a monthly downtrend. The dollar will remain in its monthly downtrend until it can close back above the upper monthly cycle band.
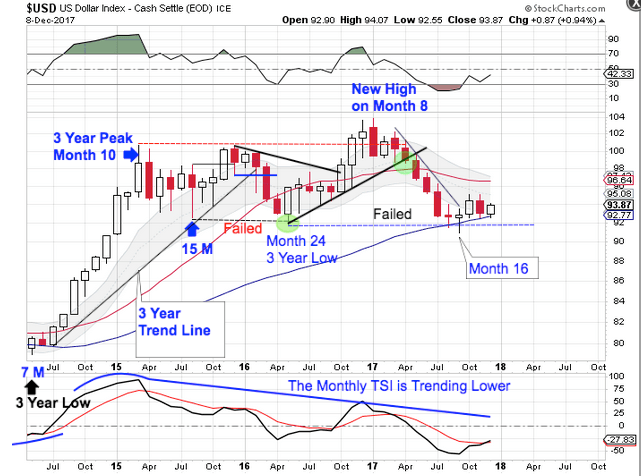
The dollar broke below the previous 3 year cycle low in September to form a failed 3 year cycle. The remaining yearly cycles should now form as left translated yearly cycles until the next 3 year cycle low forms. And with confirmation of a failed 3 year cycle, this sets up as a left translated 3 year cycle. That aligns with our 15 year super cycle analysis.
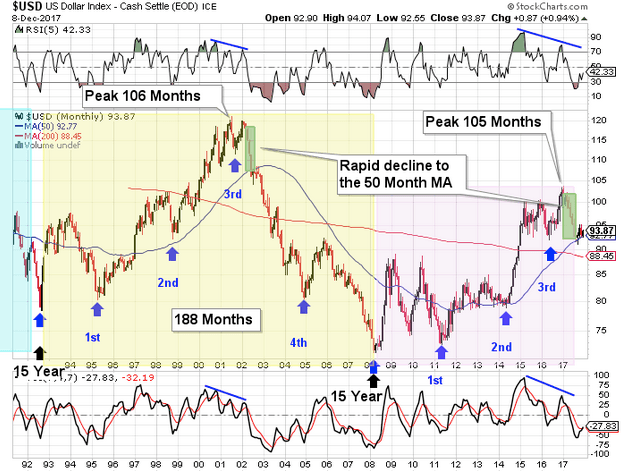
The dollar cycles through a 15 year super cycle. Each 15 year super cycle is embedded with five 3 year cycles. The dollar’s last 15 year super cycle peaked in 2001 on month 106, then declined into its third 3 year cycle low. The topping pattern in 2001 is vary similar to the current set up. The confirmation of a failed 3 year cycle confirms that the dollar has begun its 15 year super cycle decline. Once the dollar began its 15 year super cycle decline back in 2002 there was a rapid decline to the 50 month MA, as the dollar accomplished through September. The 50 month MA has provided support for the formation of a yearly cycle low. Once the new yearly cycle rolls over and the dollar loses the 50 month MA, that will confirm the bear market for the dollar.
May, 2016 hosted the 3 year cycle low, which was a shortened 3 year cycle of only 24 months. Since most times cycle balances themselves out, the dollar is positioned for the current 3 year cycle to be a stretched 3 year cycle to coincide with the start of the 15 year super cycle decline. And a stretched 3 year dollar cycle decline aligns with gold beginning a new multi year bull cycle.
Stocks
Stocks entered this week stretched above the 10 day MA. Stocks retraced to tag the 10 day MA on Wednesday, day 14.
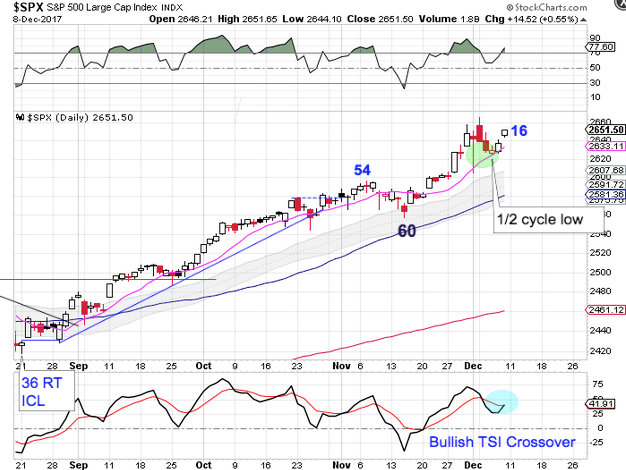
Stocks formed a swing low on Thursday. Therefore we can label Wednesday as the half cycle low. Then stocks delivered bullish follow through on Friday. Stocks are in a daily uptrend. They will remain in their uptrend unless they close below the lower daily cycle band.
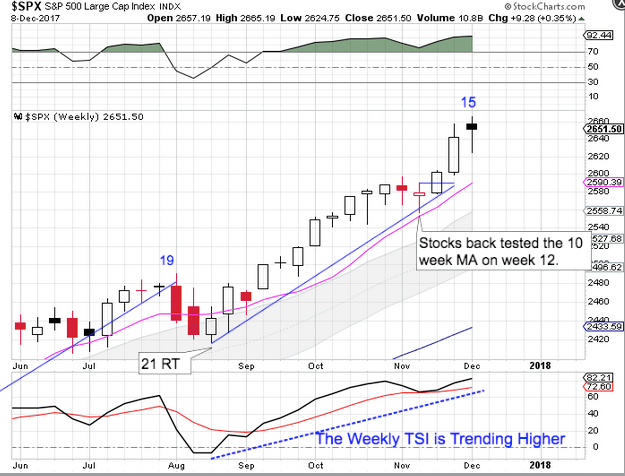
The new high on week 15 assures us of a right translated weekly cycle formation. Stocks are in a weekly uptrend. They will remain in their weekly uptrend unless they close below the lower weekly cycle band.
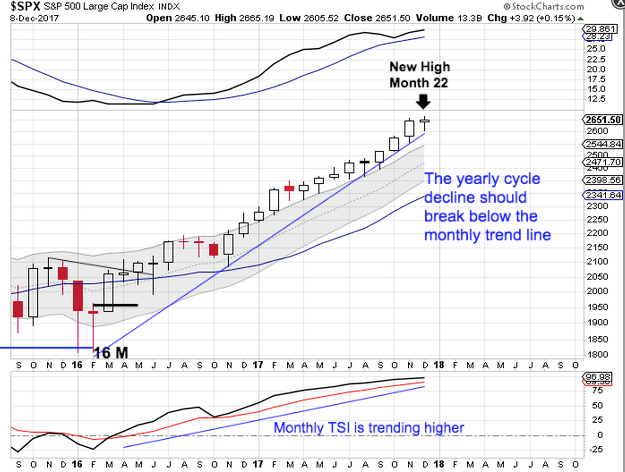
Stocks broke out to another new high in December. December is month 22, placing stocks deep in their timing band for seeking out their yearly cycle low. Since a yearly cycle low needs to occur at an intermediate cycle low, the earliest a yearly cycle low can form would be at the next intermediate cycle low. This means that the yearly cycle will extend by another 3 - 6 months.
Author

LikesMoney
Independent Analyst
Assets (such as stocks, gold, and the dollar) have identifiable cycles.


