Cycle Trading: The 11/04/16 Weekend Report Preview
The Dollar
The dollar's daily cycle peaked on day 33, formed a swing high, and then lost the 10 day MA on the previous Friday. Tuesday the dollar was firmly rejected by the 10 day moving average and closed below the upper daily cycle band to signal the daily cycle decline.
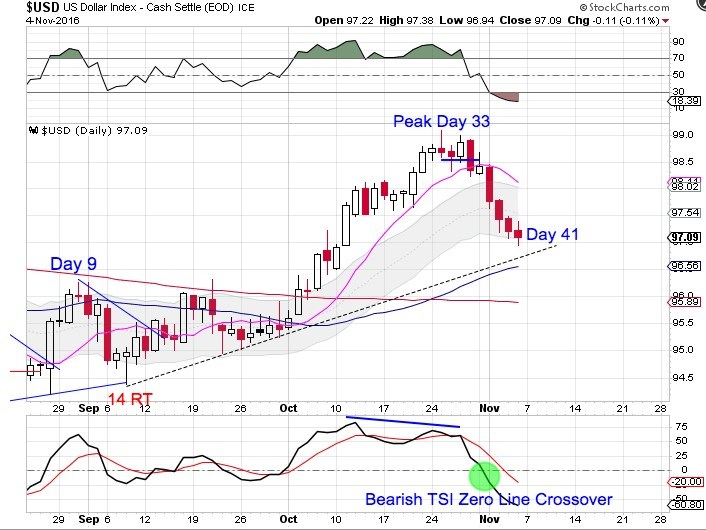
Friday was day 41 for the dollar's daily cycle. The dollar should break below the daily cycle trend line before completing its daily cycle decline. The dollar is still in a daily uptrend. A close below the lower daily cycle band would indicate an end of the daily uptrend.

While this could be week 26 I think that it is likely week 11. The dollar has formed a weekly swing high and closed below the upper weekly cycle band to signal that the dollar has begun its intermediate cycle decline. Still, the dollar remains in its weekly uptrend. It will continue in its weekly uptrend unless it closes below the lower weekly cycle band.
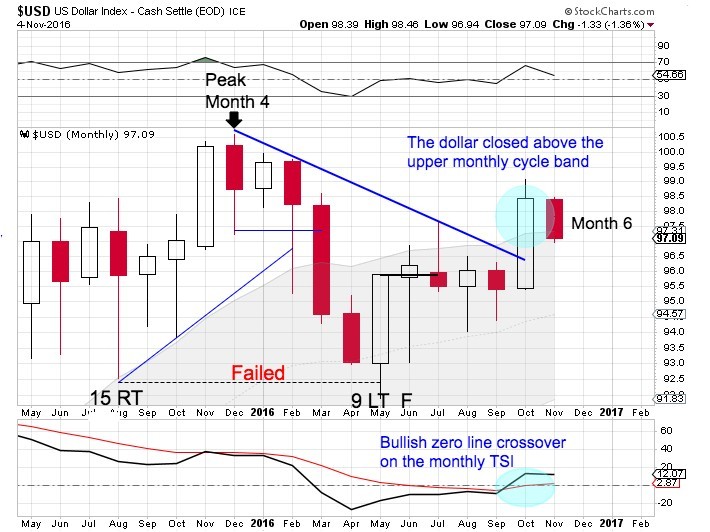
The dollar formed a failed yearly cycle in May. Our expectation was to see the dollar tag the declining monthly trend line and then continue into its 3 year cycle decline. Instead the dollar is broke above the declining monthly trend line and closed above the upper monthly cycle band for October. November is month 6 for the yearly dollar cycle. A close back below the upper monthly cycle band would indicate that the dollar has begun its yearly cycle decline.
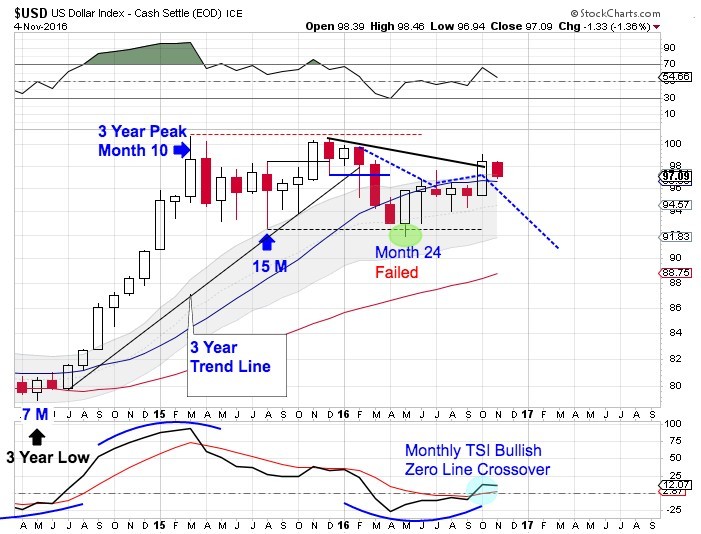
The dollar broke above the declining monthly trend line and closed above the upper monthly cycle band in October. Cycle band theory tells us that a close above the upper cycle band indicates that a cycle low of a higher order has been left behind. In other words, the close above the upper monthly cycle band signals that May printed an early 3 year cycle low. Which would make this look pretty similar to the top of the previous 15 year super cycle back in 2001-02.
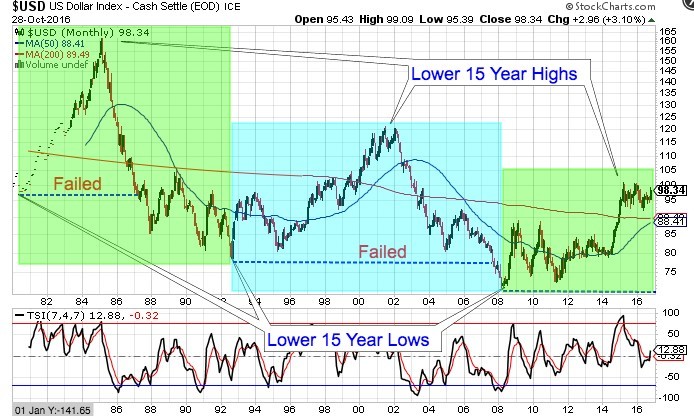
The dollar’s last 15 year super cycle peaked in 2001, then declined into its third 3 year cycle low. At the time the dollar was quite stretched above the 200 month MA as well as the 50 month MA — as it is right now. As the dollar rallied out of the third 3 year cycle low in 2001 it failed to print a higher monthly high, rolled over, and began its decline into its 15 year super cycle low.
So if May did host the 3 year cycle low, it would have been a shortened 3 year cycle of only 24 months. Since most times cycle balances themselves out, we could be poised for the next 3 year cycle to be a stretched 3 year cycle just as the dollar is ready to begin its 15 year super cycle decline. And a stretched 3 year dollar cycle decline would align with gold beginning a new bull cycle.
Stocks
Stocks closed below the lower daily cycle band the previous Friday and continued lower this week.
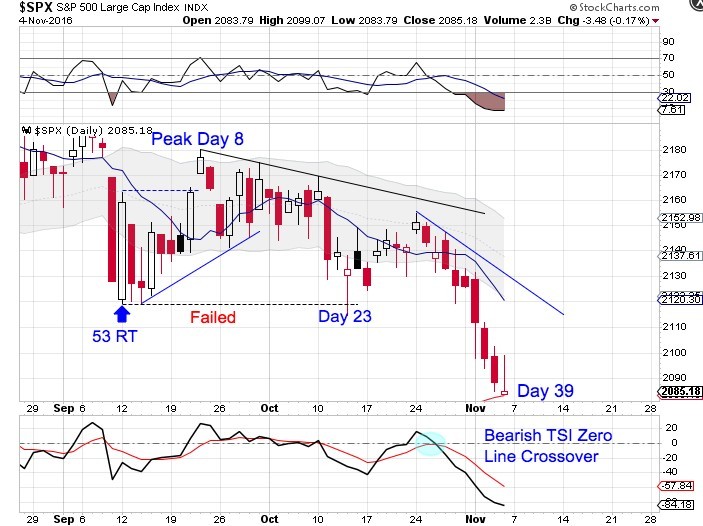
Friday was day 39 for the daily equity cycle. Stocks are in their timing band for a daily cycle low. A swing low and a break of the accelerated (blue) declining trend line will signal a new daily cycle. Stocks are in a daily downtrend. They will remain in its daily downtrend until they close back above the upper daily cycle band.
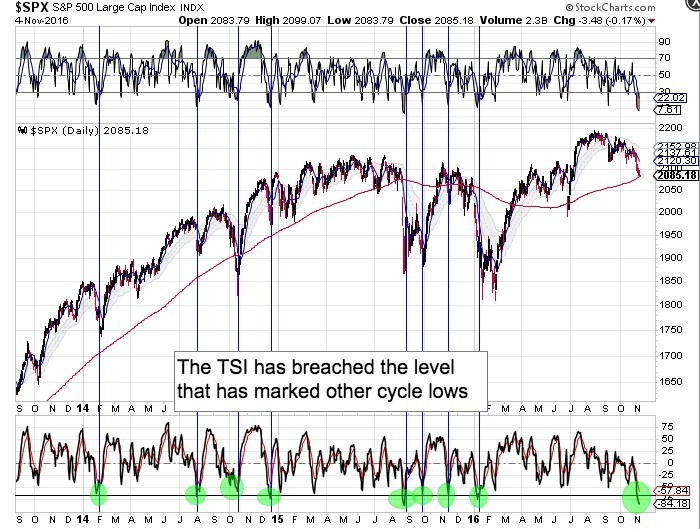
The TSI has breached the level that has marked other cycle lows.
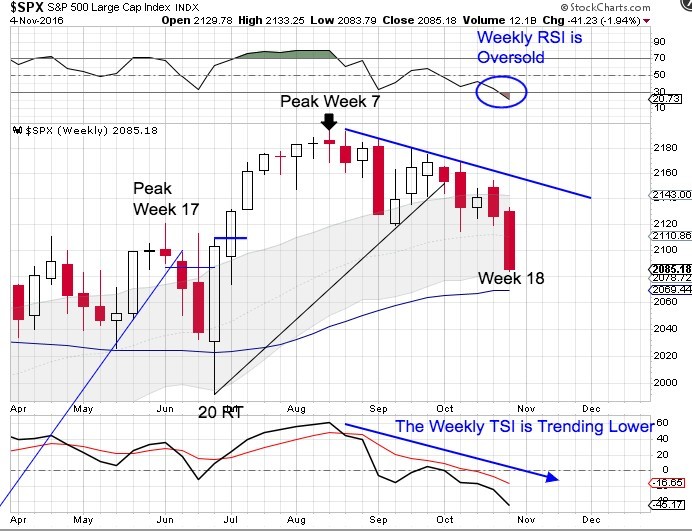
This is week 18 for the intermediate equity cycle and stocks have entered their timing band for an intermediate cycle low. There is the potential that a new daily cycle will also signal a new weekly cycle. A weekly swing low and declining trend line break would confirm the new intermediate cycle.

Stocks have formed a monthly swing high have broke below the monthly trend line indicating that stocks have begun their yearly cycle decline. Most yearly cycle declines are accompanied by a failed intermediate cycle. Stocks would need to break blow the previous weekly low of 1991.68 to form a failed weekly cycle. So one more left translated, failed daily cycle would fit this scenario.
Still, stocks are in a monthly uptrend. Stocks will remain in the monthly uptrend unless they close below the lower monthly cycle band.
Author

LikesMoney
Independent Analyst
Assets (such as stocks, gold, and the dollar) have identifiable cycles.


