Cycle Trading: Intermediate Evidence

Usually stocks break below the previous daily cycle low to form a failed daily cycle. The failed daily cycle would then confirm the intermediate cycle decline.
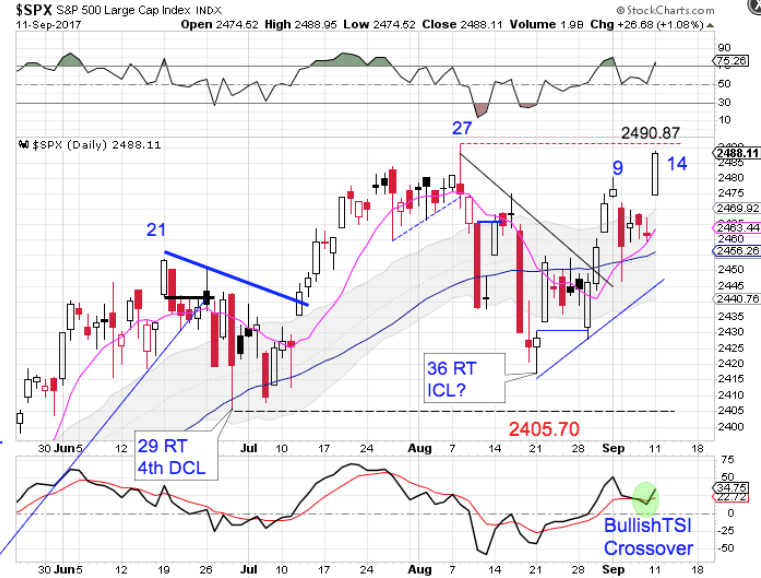
Stocks did not formed a failed daily cycle as it declined into the 8/21 daily cycle low. However all other evidence points to 8/21 hosting the intermediate cycle low.
Beginning with the daily chart. Normally a close below the lower daily cycle band indicates that the intermediate cycle decline has begun. Then after the cycle low forms, a close above the upper daily cycle band indicates that the intermediate low has been set.
Stock did close below the lower daily cycle band on its way to the 8/21 DCL. And stocks have clearly closed above the upper daily cycle band which indicates that 8/21 hosted the ICL.
The following confirm the intermediate cycle decline:
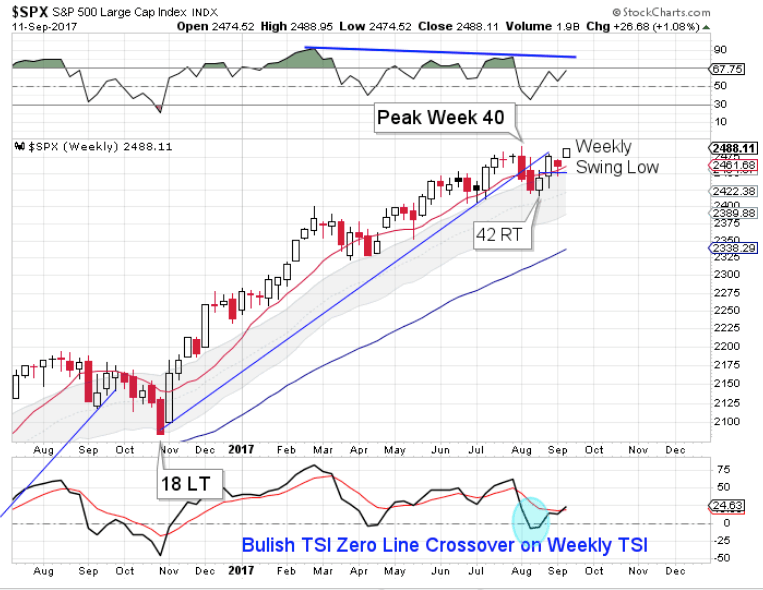
Weekly swing high
Break of the weekly trend line.
Closed below the 10 week MA
Stocks closed below the upper weekly cycle band
Bearish Zero Line Crossover on Weekly TSI
Then there is evidence from the weekly charts of an intermediate cycle low:
Weekly swing low.
Closed back above the 10 week MA.
Closed back above the upper weekly cycle band.
Bullish Zero Line Crossover on Weekly TSI.
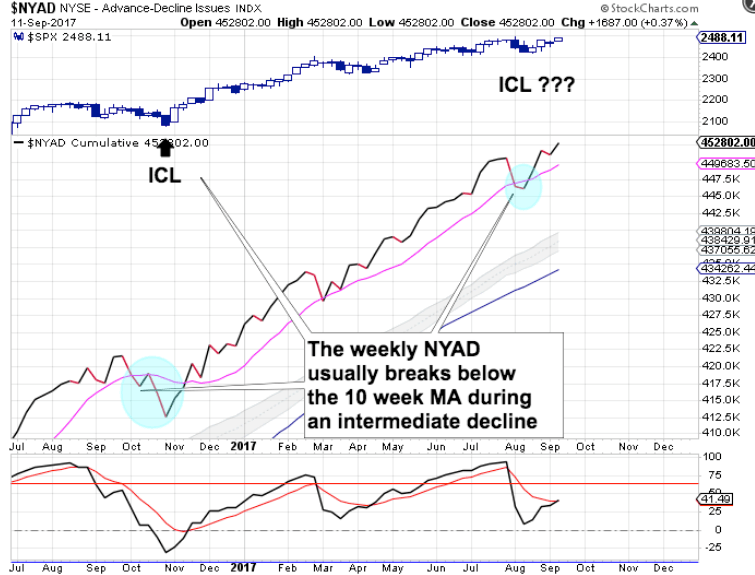
There is also evidence from the advance decline line.
The weekly Advance Decline broke below the 10 week MA, which typically accompanies an intermediate cycle decline. Regaining the 10 week MA indicates a new intermediate cycle. However the Advance Decline is breaking to new highs. Usually when the AD line breaks to new highs stocks follow.
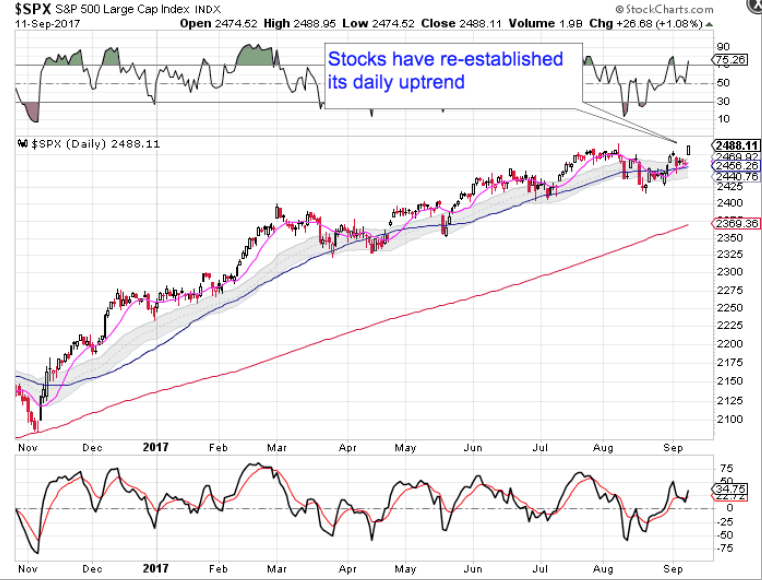
As previously mentioned; Stocks have closed back above the upper daily cycle band. This signals that stocks have re-established their daily uptrend. Therefore stocks should remain in their daily uptrend unless they close below the lower daily cycle band.
Author

LikesMoney
Independent Analyst
Assets (such as stocks, gold, and the dollar) have identifiable cycles.


