Cycle analysis: Correction is starting

SPX: Long-term trend – The bull market is continuing with no sign of a major top in sight.
Intermediate trend – short-intermediate top is forming.
Analysis of the short-term trend is done on a daily basis with the help of hourly charts. It is an important adjunct to the analysis of daily and weekly charts which discusses the course of longer market trends.
The cycle top occurred on 12/18 but important selling was delayed until the last minute because of year-end bullishness which extended into Friday’s opening. For the past three days, stocks were bought at the opening and sold immediately, but it was not until Friday’s last hour that the bears were finally able to take complete control and break the Level that had supported SPX since it made its high of 2694.97. Some serious selling took place until the last tick and, for good measure, it continued after the close.
After making its 2695 high, there were two secondary highs made at 2692+ -- the second one taking place in the first minute of Friday’s opening. This nine-day activity has created two phases of distribution which give us two potential counts for the correction on the Point & Figure chart: one of minimum expectation, and one larger which encompasses the full width of the distribution pattern. These counts, which are deemed fairly reliable, have already been passed on to subscribers. (If you value this information, you can subscribe to a trial period by accessing my website at www.marketurningpoints.com.)
With one of the two cycles bottoming in the first few days of January, I would only expect the minimum projection to be reached during this time period. After a rally, the correction should continue for a deeper and more reasonable price target to be reached.
Chart Analysis (These charts and subsequent ones courtesy of QCharts)
SPX daily chart
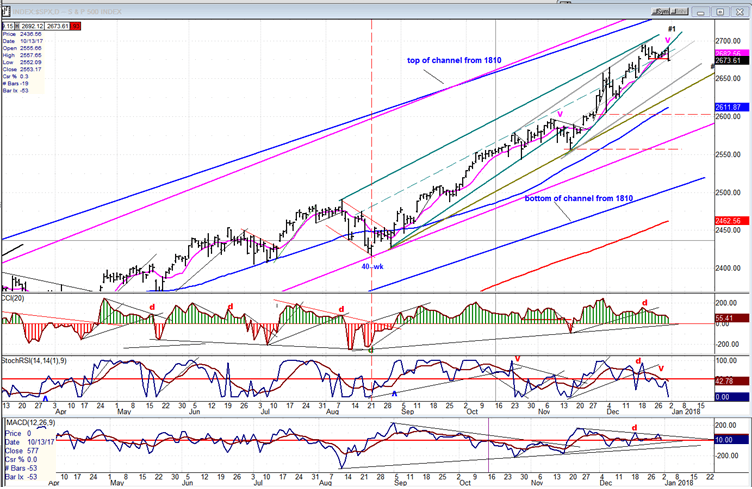
Over the past two or three weeks, I suggested that my indicators and cycle analysis were telling me that we were approaching a level which would not be the top of the bull market, but could bring about a significant correction in the SPX. More recently, I mentioned that the decline would probably start when we broke the trend line of the uptrend of a hundred and fifty points which started on 11/12 (#1).
As you can readily see on the chart, this is what happened on Friday. In fact, that trend line was broken two days before the selling could get underway. At the same time, we closed on the low of the day, slightly below the former lows of the past two weeks. The developing weakness can be seen in the oscillators at the bottom of the chart. Although only one, the SRSI, has so far given a clear sell signal, it’s evident all three have been warning for several weeks that a top was forming. They had been declining as the index was making new highs, thereby creating negative divergence. The combined tax bill deliberation and year-end bullishness kept us from getting a reversal sooner.
If you look at the last time the indicator went deeply negative (vertical dashed line), we had a correction of about 70 points after the trend line was broken. Generally speaking, as the market becomes more and more extended, corrections become deeper and deeper. Not only is it logical that this should happen, but this also has to do with market structure. As we complete waves of higher degrees, the corrections are relatively larger. In this case, we have most likely just completed a l higher degree structure than the one we completed in August and, if so, we should consequently have a correction of more than 70 points.
And here, we encounter a little technical glitch! The amount of distribution experienced at the recent top does not count as much as the size of the correction we should experience from this level. But this is easily explained. The cycle which is bottoming in a few days is a 20-wk cycle, whereby the one that bottomed in August was twice that length. This means that our first correction will be just that: the first phase of a larger correction and, after a rally in a downtrend, we should form addition distribution and go lower, repeating that process until we have attained a decline the size of what a normal retracement should be for a wave correction of that degree. We can get a fairly good sense of that measurement by using Fibonacci tools.
SPX hourly chart:
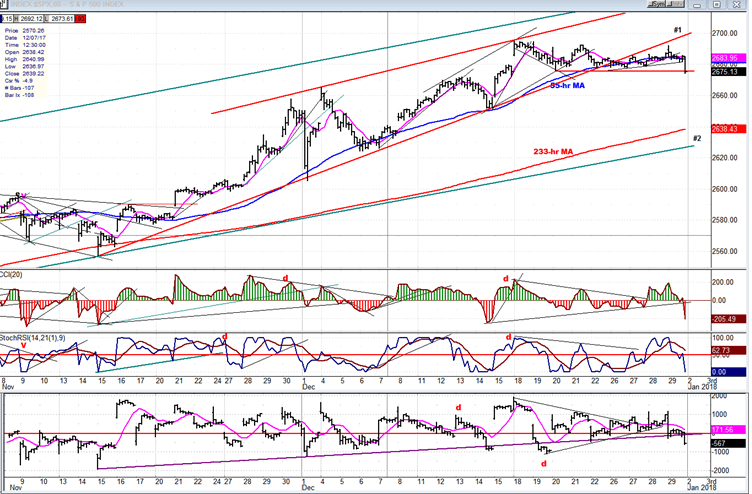
The hourly chart covers the portion of the uptrend above trend line #1 -- which is red on this chart -- as well as the trend line across the tops. Together, they form an ending diagonal triangle, a terminal pattern which was also alerting us that this uptrend was coming to an end. But, as stated earlier, this is only the ending portion of a much larger structure that will be correcting.
Note that this chart shows that trend line #1 was broken a couple of days before the start of the decline. Had this taken place during any other part of the year, we would most likely have started the decline sooner. But end-of-the-year bullishness kept prices afloat until the very end.
Everything that was traded above the red horizontal line is distribution. When converted to a P&F chart, it gives us a fairly reliable count of how deep the first phase of the correction that just started should be. And if you doubt that it has actually started, look at the oscillators! No uncertainty there! Even without being aware of the type and size of the decline that lies ahead, we can pretty well expect that the first correction should take us to the vicinity of the 233-hr MA and trendline #2 before we find some support. Depending on how long it takes us to get there, this might correspond to the amount of time remaining for the 20-wk cycle to make its low.
An overview of some important indexes (daily charts)
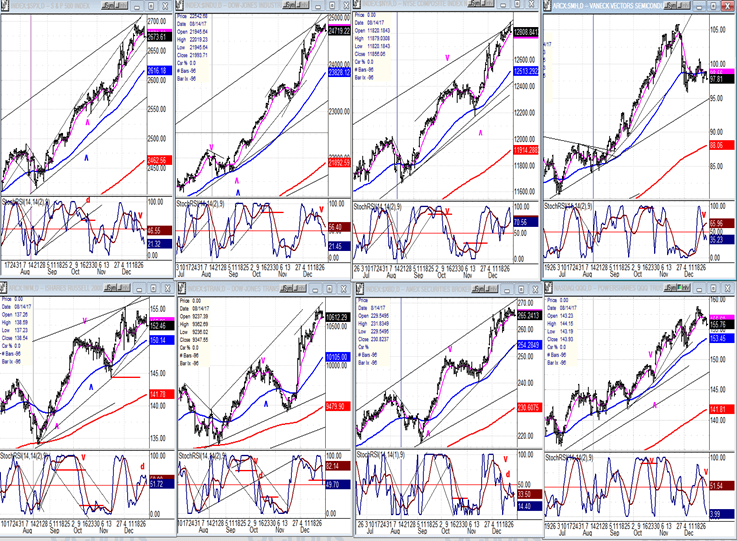
All the following indexes are beginning to show concerted topping formations, some more advanced than others, with the outstanding one being that of SMH (semiconductors-top right) which is clearly the one to have first given advanced notice that a correction was coming. The next prophetic one was IWM (bottom left) which, although it was less clear, still topped at the same time as SMH while indexes went on to make new highs. Let’s keep our eyes on these two in particular to see if they confirm our scenario for the correction.
UUP (dollar ETF)
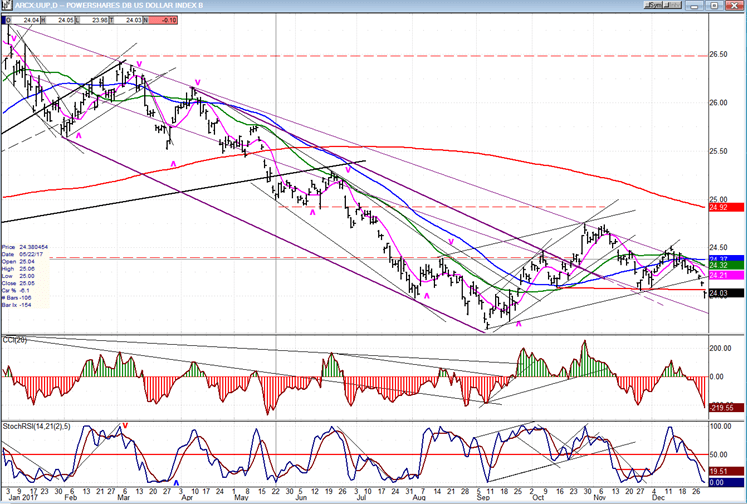
UUP has been rejected by the downtrend line for a second time and must be watched to see if it will challenge it a third time, or accelerate downward and extend its correction.
GDX (Gold miners ETF)
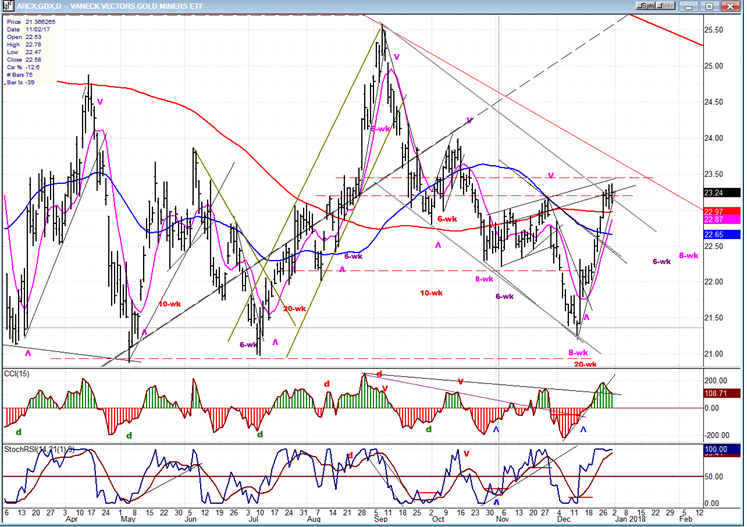
After making a strong reversal pattern precisely at the time of its cycle lows cluster, GDX ran into strong resistance which has at least slowed its advance, and perhaps even stopped it for the time being. If the latter, it will need to go through a process of consolidation before moving higher. However, no important weakness is expected at this time.
USO (United States Oil Fund)
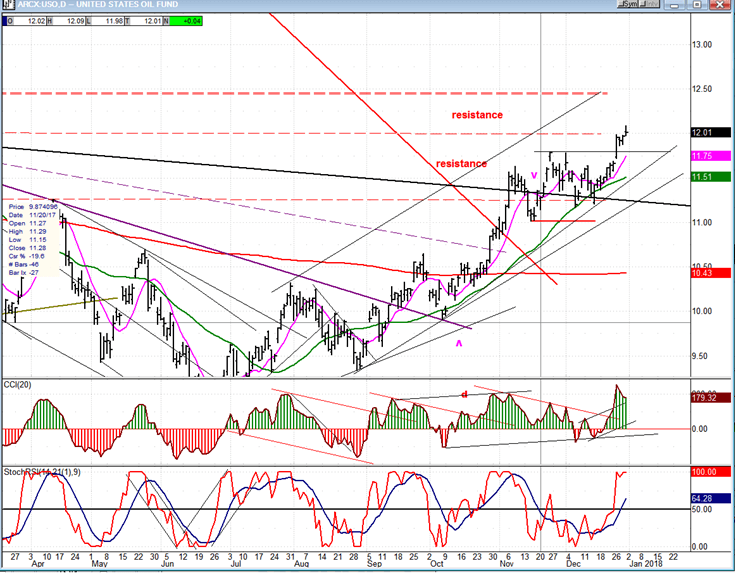
After a temporary halt at the lower level of the resistance range, USO resumed its advance and is heading for the next band of resistance, which should not be as restrictive as the first. If so, it is likely to continue to advance to its initial target of 13.50-14.00.
Summary
The 20-wk cycle, whose low occurs in a few days, is likely to trigger the initial phase of a larger decline which should continue for many more weeks, probably in stages rather than all at once.
I again want to wish all my readers a healthy and prosperous new year!
Author

Andre Gratian
Market Turning Points
When I was a stock broker years ago, a friend introduced me to technical analysis of the market and it is not an exaggeration to say that I fell in love with this approach! Ever since then, it has become an increasingly important


