Cyber Monday Doesn’t Move Markets

Good Morning Traders,
As of this writing 4:05 AM EST, here’s what we see:
US Dollar: Dec. USD is Up at 101.440.
Energies: January Crude is Down at 46.79.
Financials: The Dec 30 year bond is Down 4 ticks and trading at 153.18.
Indices: The December S&P 500 emini ES contract is 12 ticks Higher and trading at 2203.75.
Gold: The December gold contract is trading Down at 1187.70. Gold is 31 ticks Lower than its close.
Initial Conclusion
This is not a correlated market. The dollar is Up+ and crude is Down- which is normal but the 30 year bond is trading Down. The Financials should always correlate with the US dollar such that if the dollar is lower then bonds should follow and vice-versa. The indices are Up and Crude is trading Down which is correlated. Gold is trading Down which is correlated with the US dollar trading Up. I tend to believe that Gold has an inverse relationship with the US Dollar as when the US Dollar is down, Gold tends to rise in value and vice-versa. Think of it as a seesaw, when one is up the other should be down. I point this out to you to make you aware that when we don’t have a correlated market, it means something is wrong. As traders you need to be aware of this and proceed with your eyes wide open.
Asia traded mixed with half the exchanges trading Higher and the other half Lower. As of this writing Europe is also trading mixed as well.
Possible Challenges To Traders Today
– Prelim GDP q/q is out at 8:30 AM EST. This is major.
– Prelim GDP Price Index q/q is out at 8:30 AM EST. This is major.
– S&P/CS Composite-20 HPI y/y is out at 9 AM EST. This is major.
– FOMC Member Dudley Speaks at 9:15 AM EST. This is major.
– CB Consumer Confidence is out at 10 AM EST. This is major.
– FOMC Member Powell Speaks at 12:40 PM EST. This is major.
Treasuries
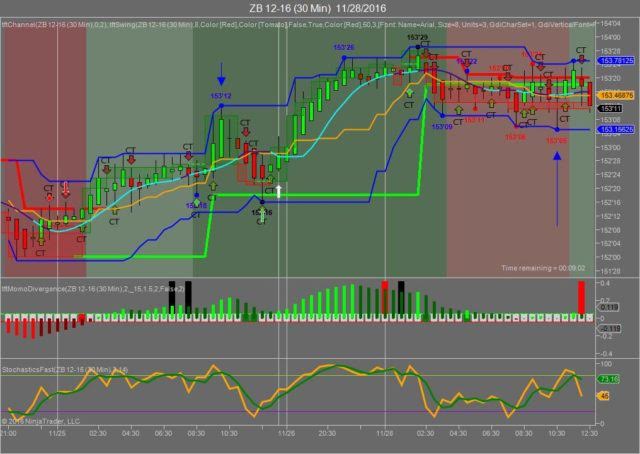
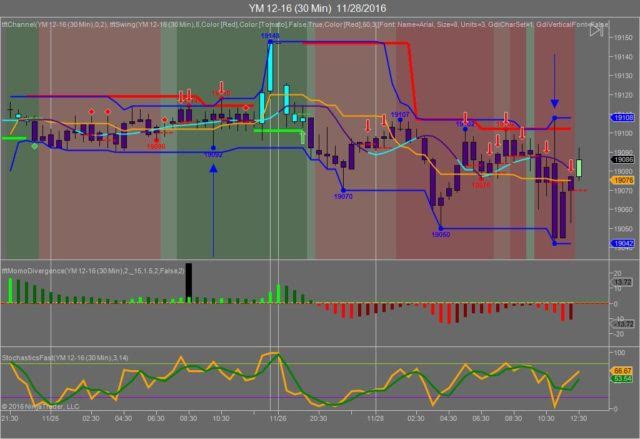
We’ve elected to switch gears a bit and show correlation between the 30 year bond (ZB) and The YM futures contract. The YM contract is the DJIA and the purpose is to show reverse correlation between the two instruments. Remember it’s liken to a seesaw, when up goes up the other should go down and vice versa.
On Friday the ZB made it’s move at around 10:30 AM EST with no economic news in sight. The ZB hit a low at around that time and the YM hit a high. If you look at the charts below ZB gave a signal at around 10:30 AM EST and the YM was moving lower at the same time. Look at the charts below and you’ll see a pattern for both assets. ZB hit a low at around 10:30 AM EST and the YM hit a high. These charts represent the latest version of Trend Following Trades and I’ve changed the timeframe to a 30 minute chart to display better. This represented a long opportunity on the 30 year bond, as a trader you could have netted about 20 plus ticks per contract on this trade. Each tick is worth $31.25. We added a Donchian Channel to the charts to show the signals more clearly.
Charts Courtesy of Trend Following Trades built on a NinjaTrader platform
Bias
Yesterday we maintained a neutral bias as the markets were just coming off a 4 day holiday in the United States and typically when this occurs the markets will gravitate towards it’s last close and then move either up or down. The Dow closed lower by 54 points and the other indices traded lower as well. Today we aren’t dealing with a correlated market however our bias is to the upside.
Could this change? Of Course. Remember anything can happen in a volatile market.
Commentary
Just yesterday we were commenting on a Santa Claus rally and the markets traded lower. Maybe it was Cyber Monday, maybe it was because Fidel Castro was pronounced dead over the weekend or perhaps it was because OPEC couldn’t come to an agreement with other countries over crude. Whatever the reason was, the markets decided to take a rest yesterday and close lower. This doesn’t necessarily surprise us and this can happen over a long holiday weekend. Today we have about 6 economic reports, most of which are major, so we may see a change today but again as we often say “only time will tell”….
Author

Nick Mastrandrea
Market Tea Leaves


