Crude Torpedoes Markets [Video]
![Crude Torpedoes Markets [Video]](https://editorial.fxstreet.com/images/Markets/Commodities/Energy/Oil/oil-industry-6501390_XtraLarge.jpg)
US Dollar: Sept USD is Down at 98.130.
Energies: Oct '19 Crude is Down at 62.21.
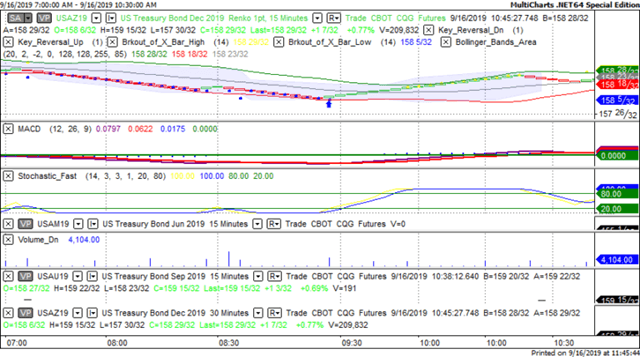
Financials: The Dec 30 year bond is Up 6 ticks and trading at 159.06.
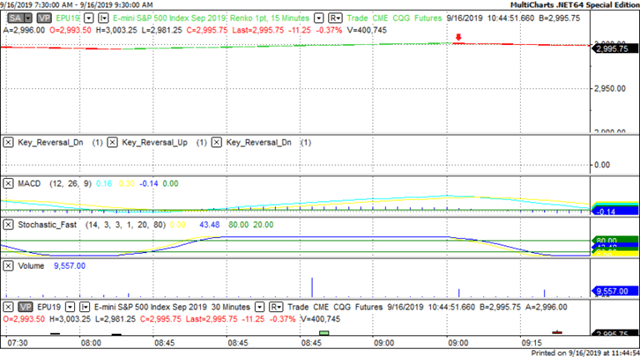
Indices: The Sept S&P 500 emini ES contract is 4 ticks Lower and trading at 2998.00.
Gold: The Dec Gold contract is trading Down at 1506.00. Gold is 59 ticks Lower than its close.
Initial Conclusion
This is not a correlated market. The dollar is Down- and Crude is Down- which is not normal but the 30 year Bond is trading Higher. The Financials should always correlate with the US dollar such that if the dollar is lower then bonds should follow and vice-versa. The S&P is Lower and Crude is trading Lower which is not correlated. Gold is trading Lower which is not correlated with the US dollar trading Down. I tend to believe that Gold has an inverse relationship with the US Dollar as when the US Dollar is down, Gold tends to rise in value and vice-versa. Think of it as a seesaw, when one is up the other should be down. I point this out to you to make you aware that when we don't have a correlated market, it means something is wrong. As traders you need to be aware of this and proceed with your eyes wide open.
All of Asia is trading Lower with the exception of the Japanese Nikkei exchange. Currently Europe is trading mainly Lower with the exception of the London and Paris exchanges which are fractionally Higher at this time.
Possible Challenges To Traders Today
-
Capacity Utilization Rate is out at 9:15 AM EST. This is major.
-
Industrial Production m/m is out at 9:15 AM EST. This is major.
-
NAHB Housing Market Index is out at 10 AM EST. This is major.
-
TIC Long-Term Purchases is out at 4 PM EST. No effect on session.
Treasuries
We've elected to switch gears a bit and show correlation between the 30 year bond (ZB) and The YM futures contract. The YM contract is the DJIA and the purpose is to show reverse correlation between the two instruments. Remember it's liken to a seesaw, when up goes up the other should go down and vice versa.
Yesterday the ZB made a major move at around 9:15 AM EST. The ZB hit a Low at around that time and the YM hit a High. If you look at the charts below ZB gave a signal at around 9:15 AM EST and the YM was moving Lower at the same time. Look at the charts below and you'll see a pattern for both assets. ZB hit a Low at around 9:15 AM and the YM was moving Lower at the same time. These charts represent the newest version of MultiCharts and I've changed the timeframe to a 15 minute chart to display better. This represented a Long opportunity on the 30 year bond, as a trader you could have netted about 20 ticks per contract on this trade. Each tick is worth $31.25. Please note: the front month for the ZB is now December. The YM contract remains at September, 2019 (for the time being) and I've changed the format to Renko bars such that it may be more apparent and visible.
Charts Courtesy of MultiCharts built on an AMP platform
Bias
Yesterday we gave the markets a Downside bias as every instrument we use for market correlation purposes was trading Higher except the indices themselves. The Dow dropped 143 points and the other indices lost ground as well. Today we aren't dealing with a correlated market and our bias is Neutral.
Could this change? Of Course. Remember anything can happen in a volatile market.
Commentary
So what happened over the weekend? It seems some Yemeni rebels called the Houthi launched drones against the Saudi oilfields and reportedly took out half of the Saudi oil supply by doing so. It is believed that they did this because the Saudi government supports the formal government in Yemen versus the rebels. The net result of this is crude is trading above the $60 a barrel mark and global markets dropped but in the US they didn't drop dramatically off the side of a cliff. President Trump has and is willing to release oil from the Strategic Reserve but the United States isn't that dependent on foreign oil. We have shale oil that can be used in lieu of foreign crude.
Author

Nick Mastrandrea
Market Tea Leaves


