On Friday, the black gold gained 1.15% and climbed to the previously-broken lower borer of the trend channel. Is this a verification of the earlier breakdown or something more?
Crude Oil’s Technical Picture
Let’s take a closer look at the charts and find out (charts courtesy of http://stockcharts.com).
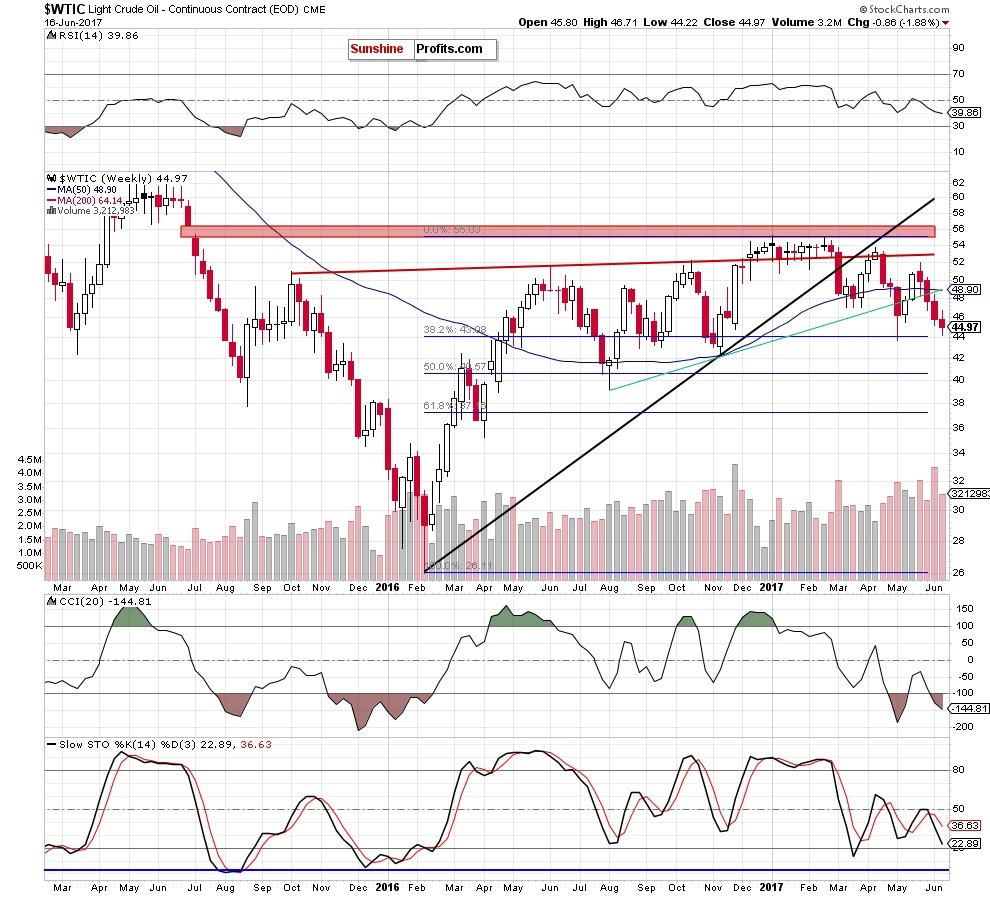
From today’s point of view, we see that crude oil moved little higher on Friday, which resulted in a climb to the previously-broken lower border of the red declining trend channel.
What does it mean for the black gold? Taking into account the sell signals generated by the weekly and daily indicators and the size of volume, which accompanied Friday’s increase (it was tiny compared to what we saw earlier during declines), we think that light crude just verified the earlier breakdown under the red line.
If this is the case, we’ll see a reversal from around $45 and another attempt to move lower in the coming week. How low could crude oil go? In our opinion, the first downside target will be around $43.08 (the 38.2% Fibonacci retracement marked on the weekly chart). In this area are also the September and November 9 lows and the red dashed support line seen on the daily chart (around $43-$43.07).
What’s interesting this pro bearish scenario is also reinforced by the current situation in the oil-to-stocks ratio.
Relationship between Crude Oil and General Stock Market
The first thing that catches the eye on the above chart is a breakdown under the lower border of the blue declining trend channel. Although the ratio declined below this line in the previous month, oil bulls pushed it higher quite quickly. However, this time the ratio closed the previous week below the ble line, which increases the probability of further declines – not only in the ratio, but also in the case of crude oil as positive correlation remains in place.
Summing up, short (profitable) positions continue to be justified from the risk/reward perspective as crude oil is still trading under the lower border of the red declining trend channel, which suggests that another move to the downside should not surprise us.
Very short-term outlook: bearish
Short-term outlook: mixed with bearish bias
MT outlook: mixed
LT outlook: mixed
All essays, research and information found above represent analyses and opinions of Przemyslaw Radomski, CFA and Sunshine Profits' employees and associates only. As such, it may prove wrong and be a subject to change without notice. Opinions and analyses were based on data available to authors of respective essays at the time of writing. Although the information provided above is based on careful research and sources that are believed to be accurate, Przemyslaw Radomski, CFA and his associates do not guarantee the accuracy or thoroughness of the data or information reported. The opinions published above are neither an offer nor a recommendation to purchase or sell any securities. Mr. Radomski is not a Registered Securities Advisor. By reading Przemyslaw Radomski's, CFA reports you fully agree that he will not be held responsible or liable for any decisions you make regarding any information provided in these reports. Investing, trading and speculation in any financial markets may involve high risk of loss. Przemyslaw Radomski, CFA, Sunshine Profits' employees and affiliates as well as members of their families may have a short or long position in any securities, including those mentioned in any of the reports or essays, and may make additional purchases and/or sales of those securities without notice.
Recommended Content
Editors’ Picks
AUD/USD holds above 0.6500 in thin trading
The Australian Dollar managed to recover ground against its American rival after AUD/USD fell to 0.6484. The upbeat tone of Wall Street underpinned the Aussie despite broad US Dollar strength and tepid Australian data.
EUR/USD comfortable below 1.0800 lower lows at sight
The EUR/USD pair lost ground on Thursday and settled near a fresh March low of 1.0774. Strong US data and hawkish Fed speakers comments lead the way ahead of the release of the US PCE Price Index on Friday.
Gold price finishes Thursday’s session set to reach new all-time highs
Gold price rallied during the North American session on Thursday and hit a new all-time high of $2,225 in the mid-North American session. Precious metal prices are trending higher even though US Treasury yields are advancing, underpinning the Greenback.
Bitcoin price extends retreat from $69K as old whales shift their holdings to new whales
Bitcoin price continues to move further away from the $69,000 threshold, gaining ground as BTC bulls hope for a retest of the $73,777 peak. This is because of the general assumption that clearing this blockade would set the tone for a reach higher, marking a new all-time high.
Bears have been standing before a steamroller so far this year
Despite a pushback on rate cuts from Christopher Waller, and what was supposed to be cautious trading sentiment ahead of critical US inflation data released later on Friday, the S&P 500 rose on Thursday, marking its best first-quarter performance in five years.