Crude Oil Turns Negative After Iran's Attack Spike

Crude Oil turned negative once a new high was reached on Wednesday, ending at $65.62, driven by Iran's missile attack on a group of the United States military bases in Iraq.
Currently, Crude Oil has dropped 94 cents or 1.50%, touching $61.72, while Brent Oil stumbles 79 cents or 1.14% falling to the $67.54
On Wednesday morning, Iranian forces carried out a retaliatory attack against United States forces in Iraq. The attack was carried out employing more than a dozen ballistic missiles against various bases housing United States troops in Iraq, according to Pentagon officials.
These attacks caused the rise of crude Oil up to April 2019 levels.
Iranian Foreign Minister Mohammad Javad Zarif public on the social network Twitter what "we do not seek an escalation or a war, but we defend ourselves from any aggression."
Meanwhile, United States Defense Secretary Mark Esper pointed out hours before the attack that "we are not looking to start a war with Iran," adding that Washington wants to see the situation reduced.
An escalation of the conflict between the United States and Iran could significantly affect the market, particularly the energy sector, because Iran is one of the largest oil producers in the world.
Technical Overview
The daily chart shows that Crude Oil has completed a bullish movement identified as a wave (B) of Intermediate degree labeled in blue.
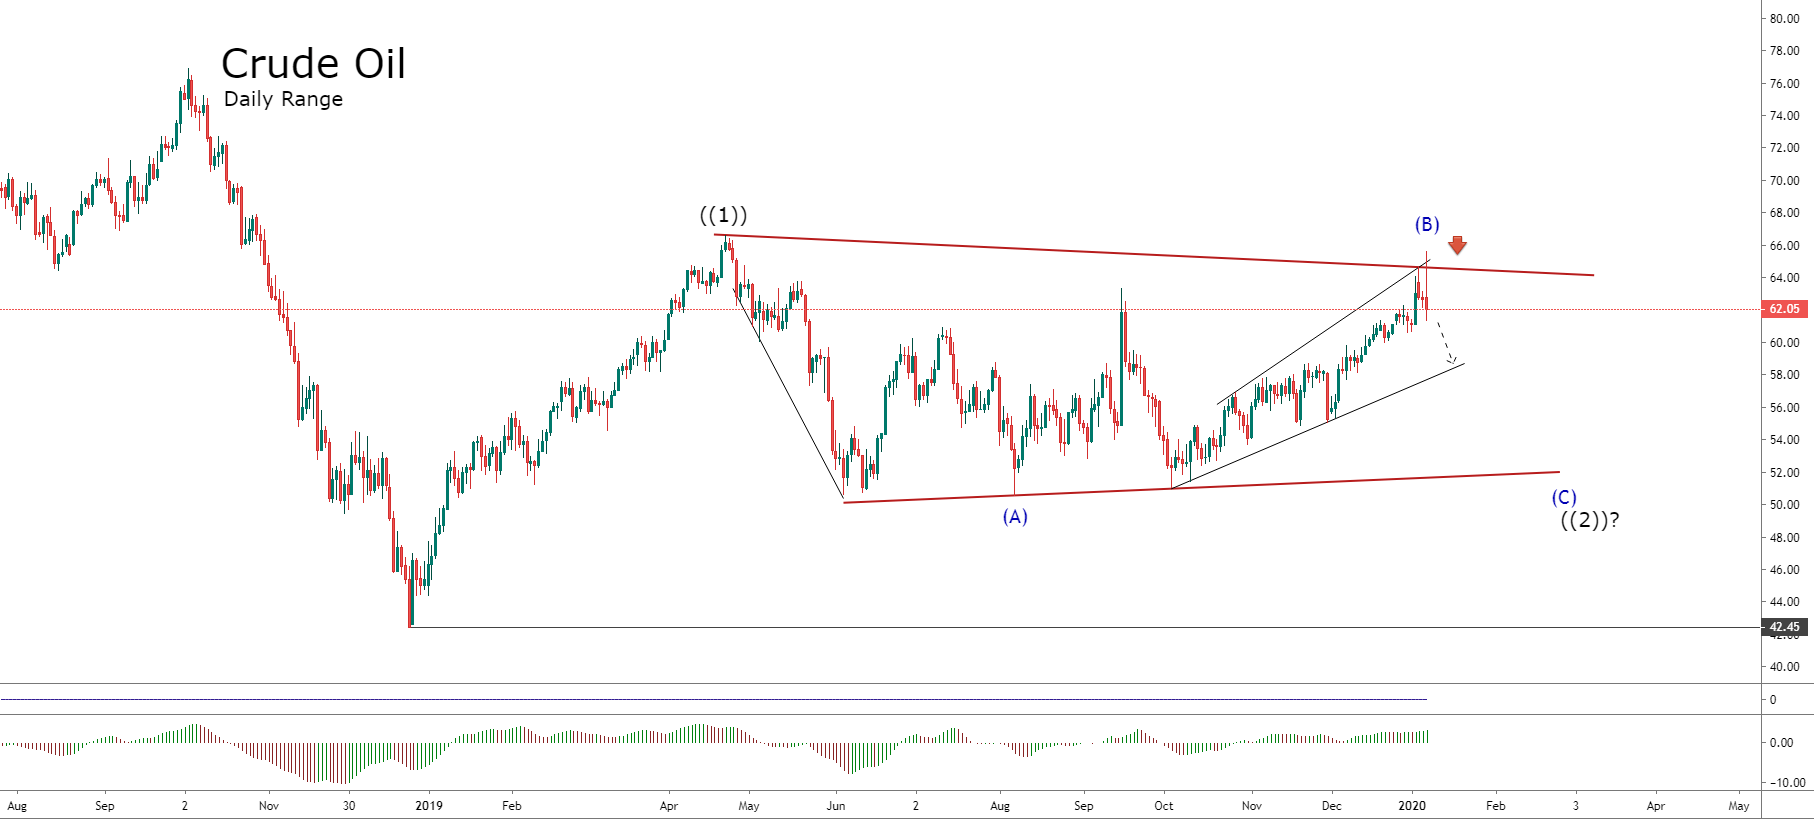
Elliott's long-term structure suggests it might correspond to a regular flat pattern. This would mean that the next bearish segment should correspond to a wave (C) of Intermediate degree. According to wave theory, a flat formation has an internal sequence divided into 3-3-5.
At the same time as the wave (C) is completed, the Crude Oil should complete a wave ((2)) of Primary degree labeled in black. This movement should give way to a wave ((3)), which should bring the price to new highs, probably to highs of 2018.
A second scenario is whether Crude Oil develops a decline in three waves instead of five. This would mean that the long-term structure would not correspond to a flat pattern, but could be a triangle structure. According to wave theory, the triangle pattern has an internal sequence divided into 3-3-3-3.
Consequently, although both declining scenarios indicate the possibility of a decline on a ((C)) wave, the internal sequence that this movement follows will be indicative of the next probable move. If it is a triangle, the price could be kept side by side for a considerably longer time than in the case of a flat formation.
Author

EagleFX Team
EagleFX
EagleFX Team is an international group of market analysts with skills in fundamental and technical analysis, applying several methods to assess the state and likelihood of price movements on Forex, Commodities, Indices, Metals and


