Crude Oil – Rewarded Bears

The first session of the week encouraged oil bears to another attack on the nearest support zone. Despite the initial success and a fresh October low, the buyers withstood their opponents’ pressure once again, blocked the way to lower levelsand pushed the price of the commodity right under the barrier of $70. Do oil bulls have any solid technical arguments on their side to fight for higher prices of black gold?
Let’stake a look at the chart below.
In our Thursday’s Oil Trading Alert, we wrote that (…) the next downside target will be around $68.51, where the size of the downward move will correspond to the height of the blue consolidation.
From today’s point of view, we see that the situation developed in tune with the above scenario and the commodity reached the downside target during yesterday’s session, making our short positions even more profitable.
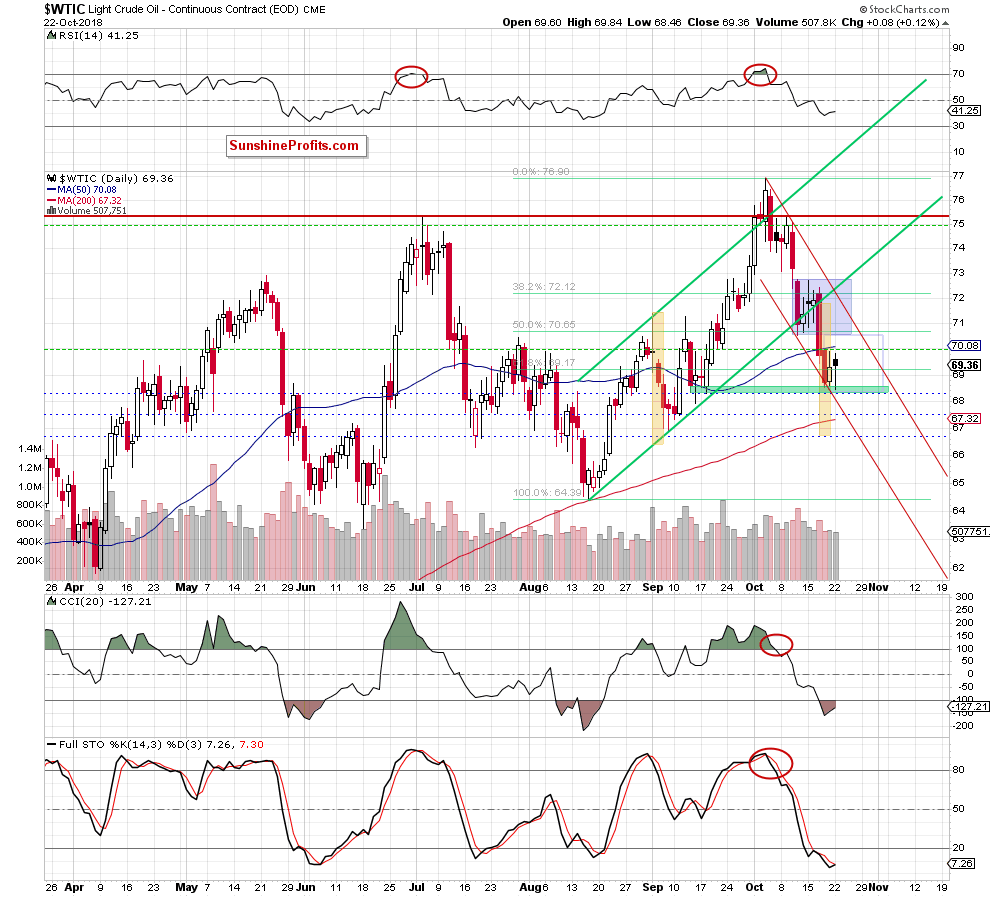
Thanks to this drop, black gold also slipped to the green support zone based on the lows created around mid-August, which encouraged oil bulls to fight for higher prices of the commodity. As a result, crude oil bounced off this support area and approached the previously-broken 50-day moving average and the barrier of $70.
Despite this improvement, there was no breakout above these resistances, which suggests that we were witnesses of the next verification of the breakdown (we wrote about the first such price action in yesterday's alert, because we could see it after the closure of Friday’s session).
Although this is a bearish development and there are no buy signals generated by the daily indicators, there are several important technical factors that can thwart pro-declining plans of the sellers in the coming days.
What do we mean by that?
Firstly, as we mentioned earlier, light crude slipped to the area where the size of the downward move corresponded to the height of the blue consolidation, which can reduce the selling pressure in the coming day(s). Why? Because oil bears who prefer swing-trading may decide to take profits from the last drop, covering their short positions.
Secondly, as you see on the daily chart, black gold is currently moving inside the very short-term red declining trend channel. The lower border of the formation intersects the above-mentioned green zone, giving an additional support to this area.
Therefore, we think that even if the price of the commodity moves lower once again, the space for declines may be limited by the lower border of the red trend channel (currently at around $67.90, which almost coincides with the August 13, 2018 low).
Thirdly, the above assumption is also reinforced by the current position of the daily indicators. Yes, you are right, they haven’t yet invalidated the sales signals generated at the beginning of the month, but have dropped to their oversold areas, increasing the probability of reversal in the very near future.
Nevertheless, the most important factor that aroused our vigilance in this area is invisible from this perspective. In our earlier alerts, you could read many times that even when we focus on “a singular tree” (the pronunciation of a single session), we should always have a broader picture of “the whole forest” in our head. In other words, we should observe changes in the medium- and the long-term perspective. Why? Let’s take a look at the monthly chart below.
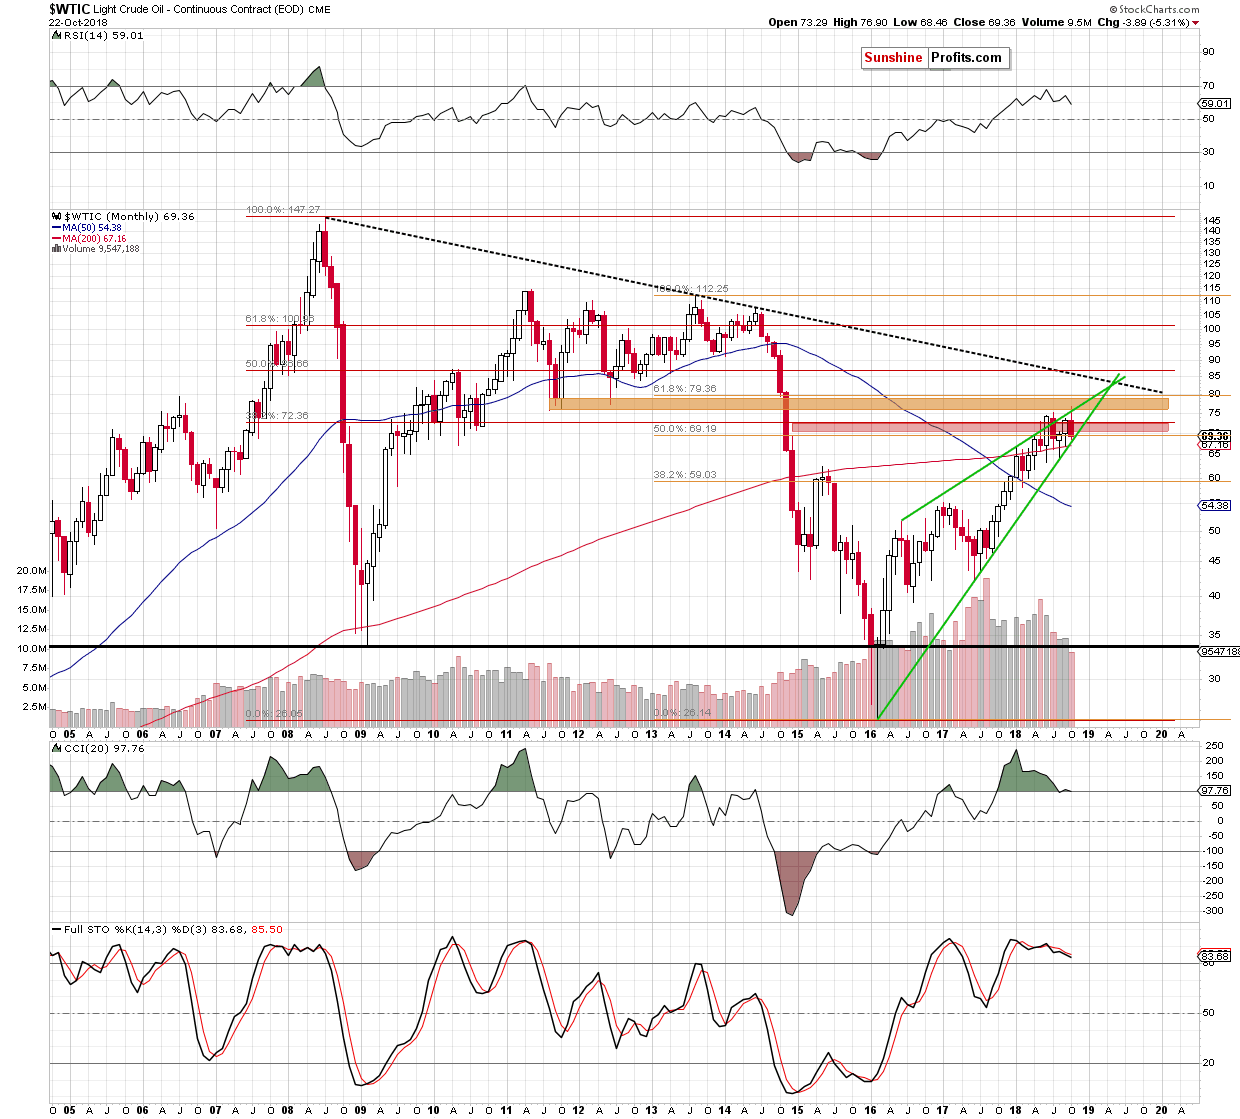
From this perspective, we see that this month’s downward move took crude oil to the lower border of the green rising wedge. As you can see, this support was strong enough to stop oil bears in August and trigger a rebound, which formed a fresh 2018 peak. Additionally, not far from it (at $67.16) is also the 200-month moving average, which stopped the buyers in September.
Taking into account these strong and very important supports, we think that as long as there is no successful breakdown below them another rebound from here should no surprise us – especially when we factor in the above-mentioned short-term technical factors.
Therefore, to avoid reducing the current profits, we decided to take them off the table by closing our short positions (as a reminder, we opened them when crude oil was trading at around $75)and wait at the sidelines for another profitable opportunity
Want free follow-ups to the above article and details not available to 99%+ investors? Sign up to our free newsletter today!
Author

Nadia Simmons
Sunshine Profits


