Crude Oil – How Many Minutes to Midnight Before We Act?

Yesterday, some might have wondered where is the limit to the upswing in oil. It would be natural to expect it to catch up to e.g. gold and silver upswings. Would be, could be. We just saw something that made us act. Diligently, with foresight and confidence – when the odds are with us. It’s time to share it with you.
Let’s examine the charts below to find out (charts courtesy of http://stockcharts.com).
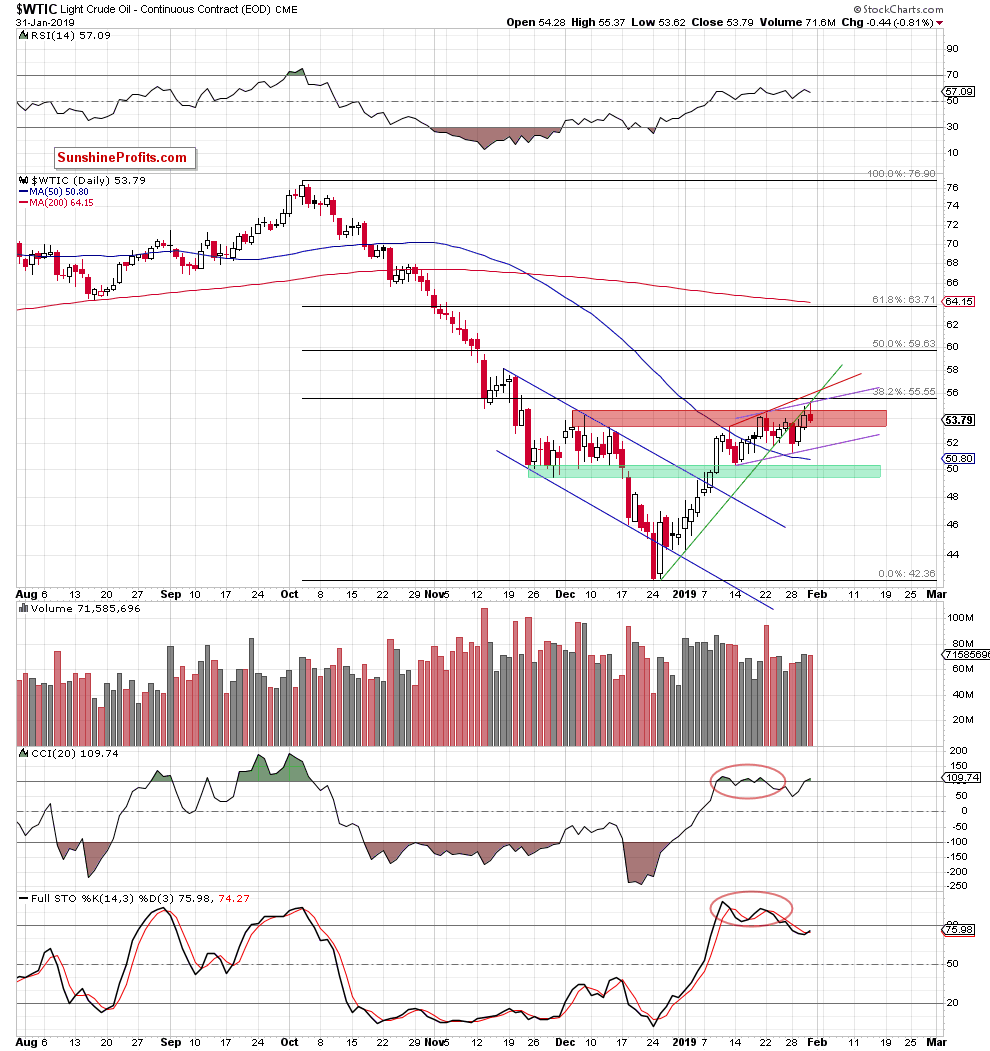
Yesterday, crude oil broke above December peaks and hit a fresh January high on intraday basis. The buyers, however, showed hesitation and didn’t close the day on a strong note at all. The long upper knot and especially the close near the daily lows clearly show that – this is what a reversal looks like. The volume was not too shabby, giving credibility to the rejection of upside move.
You see, that is the strength of the proximity of 38.2% Fibonacci retracement and of another verification of the previously-broken green line. Now we have three daily closes below it which makes its breakdown confirmed. Black gold also climbed to the upper border of the very short-term purple rising trend channel – and again was rejected at it.
All these illustrate the weakness of the buyers and correspondingly increases our confidence in taking action. We are glad we can share this opportunity with you.
On top of that, the commodity closed another day below the upper border of the red resistance zone based on the December peak. It looks like the entry of oil bears to the trading floor in earnest is just around the corner.
Interestingly, the CCI invalidated its earlier sell signal, while the Stochastic Oscillator generated a buy one, but taking into account their recent action we do not trust them enough to base investment decisions on their signals alone. These and so many other indicators are derivatives of the price, meaning that they are lagging behind it. In other words, it is first about the price and only then about the indicator.
So, what do we base our decisions on? We believe in price action and technical analysis, which tell us that lower oil prices are only a matter of time (and a very short one at that) – especially when we factor in the situation the following key ratios.
Crude Oil – Gold Link – Divergence at First Sight
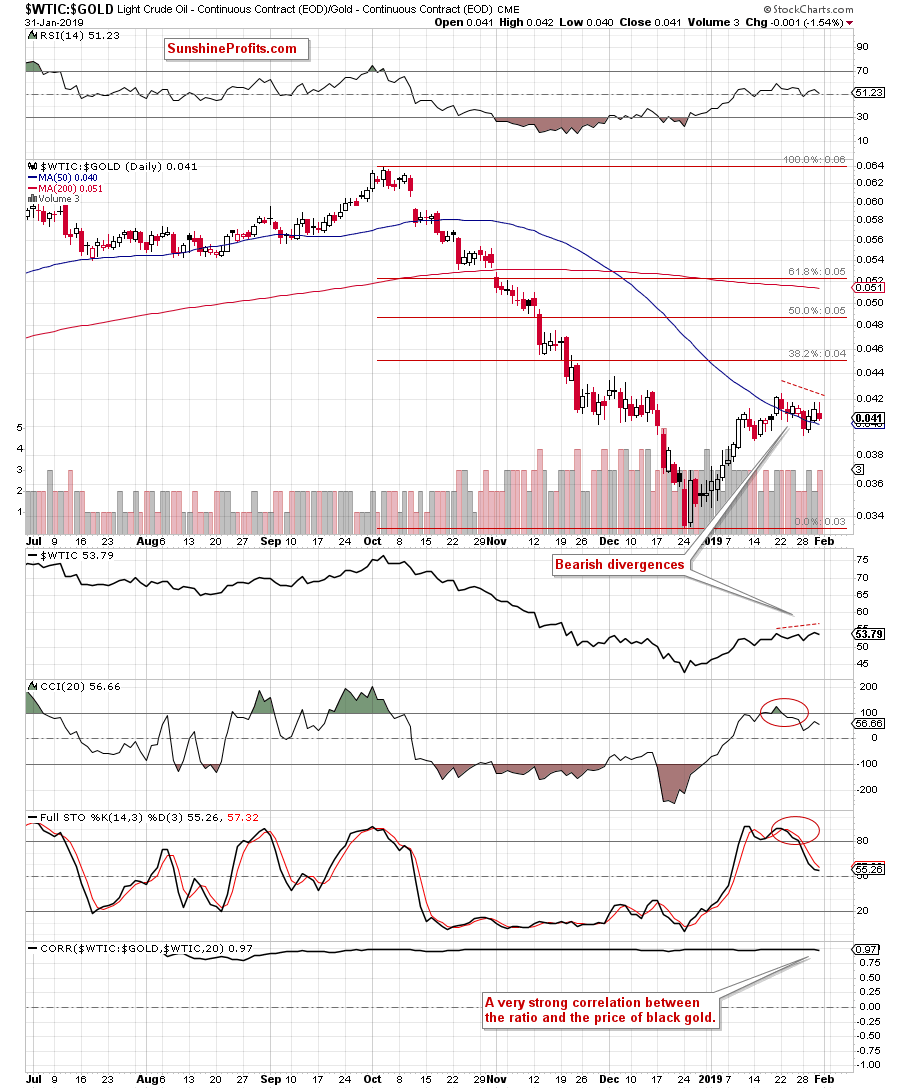
From this perspective, we see that a very strong correlation between the ratio and the price of black gold remains on the cards for many months. No wonder, crude oil is in the numerator of the ratio.
However, we noticed something interesting, which can translate into another profitable opportunity similar to us riding the downtrend since the topping process in early October. Back then, we opened the short position on Oct 5th and partially closed it on Oct 12th to capture almost $5 dollars of the move – and got out later with the rest for even more. Our subscribers were prepared. But what do we mean by something interesting?
Analyzing the charts, we discovered that although both crude oil and gold hit fresh January highs during their recent sessions, the same was not true in the case of the oil-gold ratio. Why should we care?
It is a clear bearish divergence as crude oil is making a local high and gold even more so, yet the ratio doesn't follow. And it is important because gold and gold-oil ratioare so strongly positively correlated. Therefore, the odds are that oil will follow the ratio down as the ratio is not making a new high while oil is.
Additionally, when we compare the daily chart of crude oil and the ratio, we clearly see that the latter is much lower in relation to the 38.2% Fibonacci retracement and December peaks than the price of the commodity itself, which we can read as another bearish signal.
On top of that, when we focus on the weekly chart of our oil-gold ratio, we see that it didn’t even manage to break above the 200-week moving average in recent weeks.
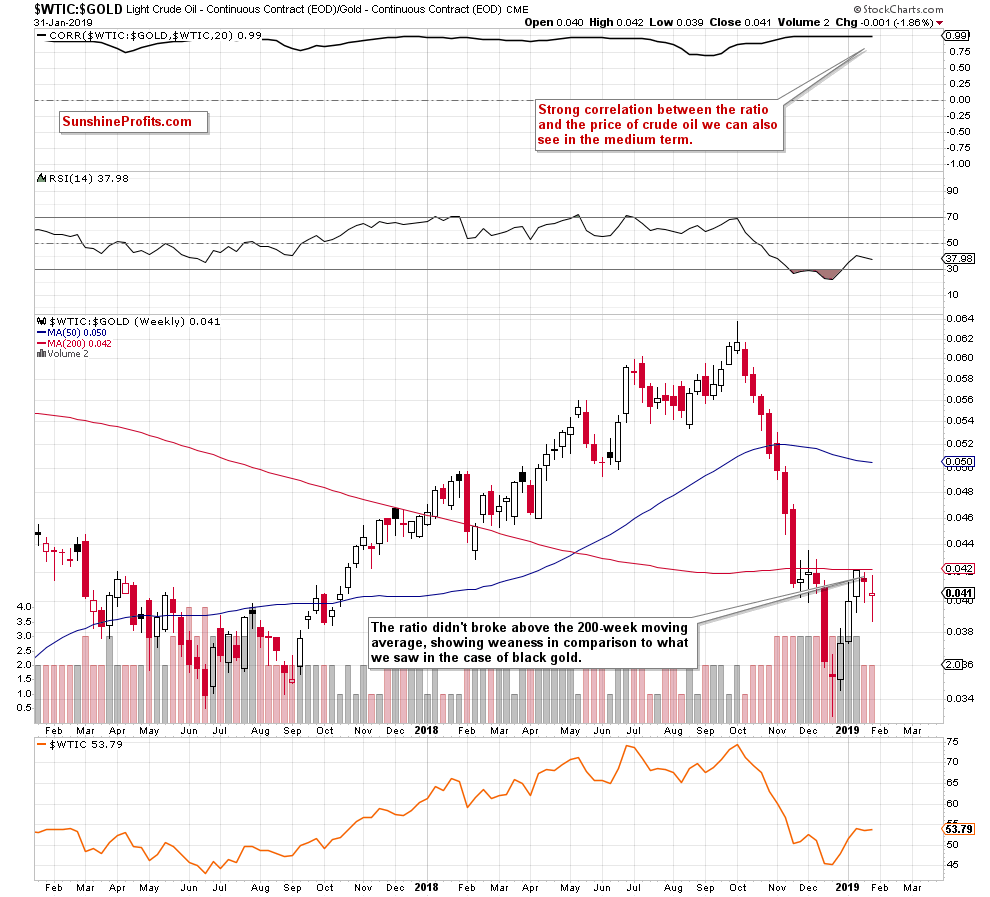
Such price action is an additional bearish factor, which increases the probability of oil price reversal from the current levels in the very near future.
We always want many factors pointing in the same direction to maximize odds in our favor. This is what prudent trading is about – the patience to wait for when the opportunity presents itself.
Will the analysis of oil-silver ratio add further bearish arguments?
Crude Oil – Silver Ratio – Another Divergence in Plain Sight
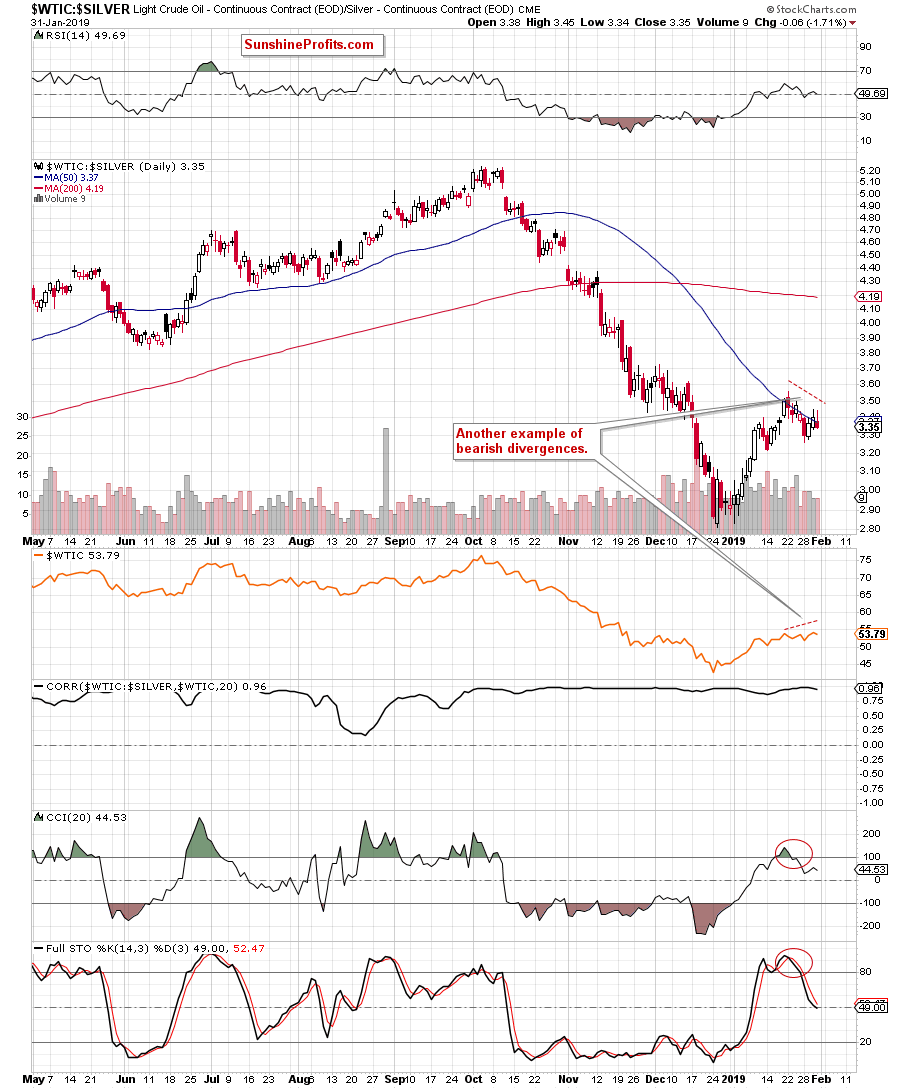
Wash, rinse, repeat. Again, the bearish divergence between the ratio and black gold price is the first thing that catches the eye on the daily chart.
It's not only that. We see one more sign of weakness, this time in the ratio itself. Take a look at the 50-day moving average. From today’s point of view, we see that the ratio broke above it only yesterday while the oil did that in the middle of the month already. This emphasizes the weakness of the ratio in relation to the price of the commodity itself. Remember that the ratios are leading indicators – the same relationship exists in the gold market itself between gold price and gold miners' price. You can exploit this and many other tools in our Gold Trading Alerts.
That's all very fine but what does it all mean for us in practice?
As we mentioned earlier, there is a very strong correlation between crude oil and the oil-to-gold ratio. We can observe the same in the case of the oil-to-silver ratio. This means that if the ratios move lower in the very near future, there is a high probability that the price of light crude will do the same – just like it did many times in the past.
Therefore, keeping an eye on their behavior may be a good confirmation of the decision to open short positions in crude oil in the very near future.
Before summarizing, we would like to add one more thing. Despite yesterday’s fresh price peak in crude oil, note that the oil-to-gold ratio didn’t even climb above Wednesday’s high, which again underlines the weakness of the bulls.
Additionally, the ratio is still trading below its 200-week moving average, while the oil-to-silver ratio invalidated Wednesday’s tiny breakout above its 50-day moving average. This further supports the bearish case.
Summing up, crude oil hit a fresh January peak, re-approaching the 38.2% Fibonacci retracement and the upper line of the very short-term trend channel. There was no breakout above them, suggesting that the buyers are likely losing strength. Black gold also verified the earlier breakdown under the green support line (the one based on the December and January lows) and confirmed it by closing below for the third time in a row. On top of that, we haven’t seen correspondingly bullish action in its leading ratios, which suggests reversal in oil price soon.
Want free follow-ups to the above article and details not available to 99%+ investors? Sign up to our free newsletter today!
Author

Nadia Simmons
Sunshine Profits


