Crude oil extends gains for fourth day

Crude oil prices are up for the fourth consecutive day, with Brent also being up for the third straight week and WTI for the second. A number of fundamental factors are helping to support oil prices at the moment. In short, stronger demand and ongoing supply restrictions from the OPEC and Russia are the main reasons for the oil price upsurge. Production fell in Libya, Gabon, Venezuela and Iraq, which helped to cause OPEC's supply drop by 79,000 barrels a day to 32.76 million in August. This has eased concerns that the oil cartel's deal with a number of non-OPEC producers to restrict supply was not working. In fact, non-OPEC producers like Russia have been quite compliant with the production cuts thus far. The OPEC itself has largely stuck to the agreement and has repeatedly suggested it would increase the production agreement in the event OECD oil inventories do not fall as expected. Meanwhile demand for oil surged in the second quarter, most notably from OECD countries including Germany and the US, according to the International Energy Agency (IEA). The IEA now expects oil demand growth of 1.6 million barrels per day this year and 1.4 million next. In the US, while crude inventories have surged higher as a result of the hurricanes, production is likely to have fallen sharply as the storms rampaged through the oil producing regions in Texas and Louisiana. The supply disruptions here have also helped to boost energy prices. But in the medium to long term, the direction of oil prices will be influenced to a great degree by US crude production changes. As oil prices stabilise further, US shale oil production is likely to increase. This will probably keep a lid on oil prices in the long-term. But in the short-term, we maintain our bullish view.
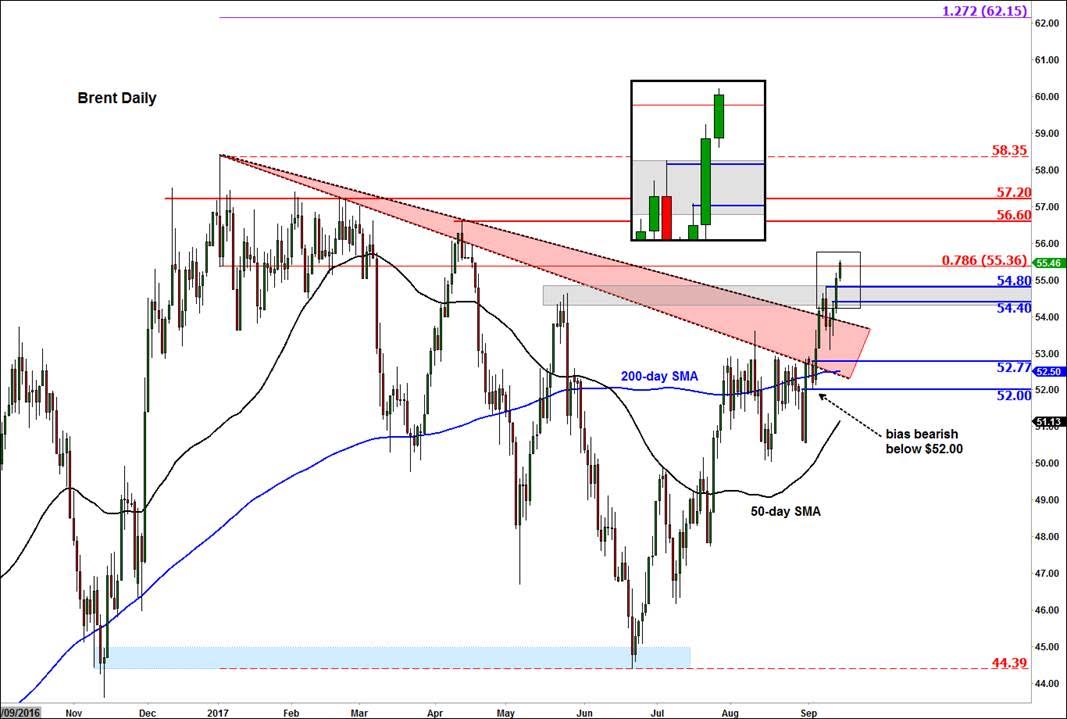
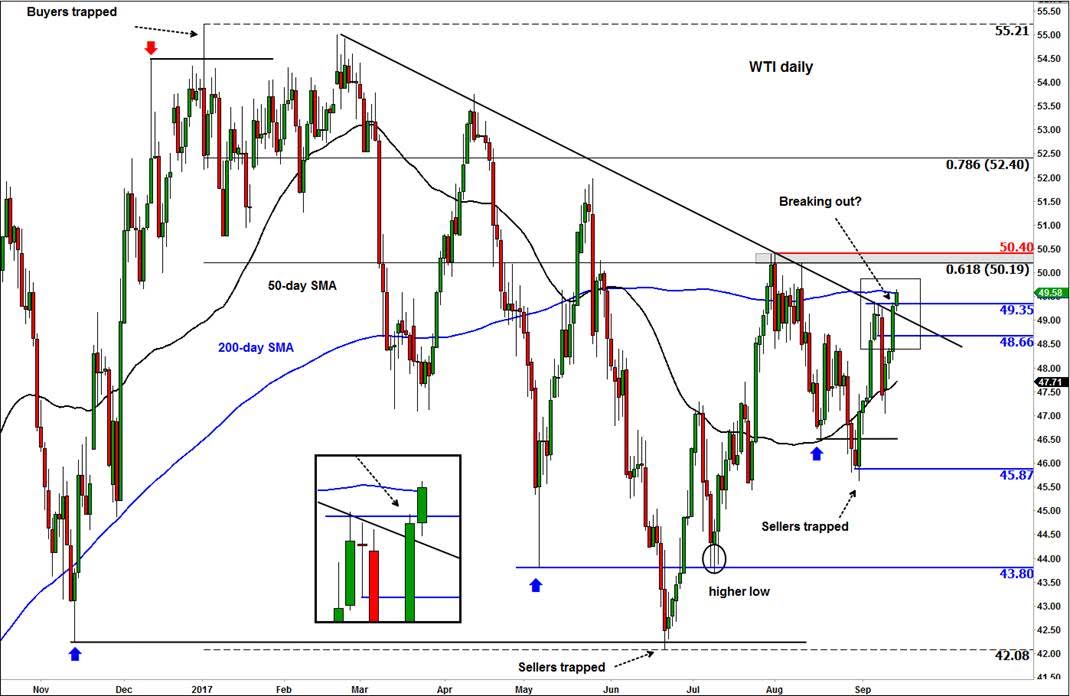
As a result of the oil price upsurge, both oil contracts have broken out of their respective key resistance areas. Consequently, the path of least resistance is now clearly to the upside for both contracts. This means we expect the dips to be bought and rips to be used as profit-taking opportunity rather than actual selling. This view will remain in place until the charts tell us oil prices have topped out. Brent has taken out a band of resistance in the $52.50-$54.50 range. Here, a number of technical indicators had converged, including, but not limited to, the 200-day average, a couple of bearish trend lines and horizontal resistance. Brent now needs to hold above this area on any potential re-test, to maintain its bullish bias. Specifically, the key short-term support area to watch now is between $54.40 and $54.80; this range was previously resistance. In terms of resistance or bullish objectives for Brent, levels such as $56.60, 57.20 and the 2016 high at $58.35 are the ones to watch going forward. At this stage, only a break below $52.00, would, in our opinion, invalidate the short-term bullish view. Meanwhile WTI has taken out its own bearish trend line, although unlike Brent, it is lagging behind not just in terms of price but also in terms of its current location relative to its corresponding technical levels. For example, unlike Brent, WTI is still hanging around its 200-day average and it is yet to break above the previous swing high at $54.40. Nonetheless, we expect WTI to follow Brent prices higher. Still, out of the two contracts, Brent is the obvious choice for bulls. This makes WTI the ideal candidate for the bears when oil prices start rolling over again.
Author

Fawad Razaqzada
TradingCandles.com
Experience Fawad is an experienced analyst and economist having been involved in the financial markets since 2010 working for leading global FX, CFD and Spread Betting brokerages, most recently at FOREX.com and City Index.


