|

Crude Oil Elliott Wave technical analysis [Video]

WTI Elliott Wave analysis

WTI Crude Oil technical overview

Trend: Bearish.

Structure: Double Zigzag.

Outlook: Continuation Lower Toward Sub-$50 Levels.

Summary

WTI Crude Oil is expected to extend its decline after completing a minor bounce that ended around June 22, 2025. The broader outlook remains bearish, with the current structure indicating that the commodity is still within a long-term corrective phase that began in March 2022. As the structure remains incomplete, the downside bias continues with targets below $50.

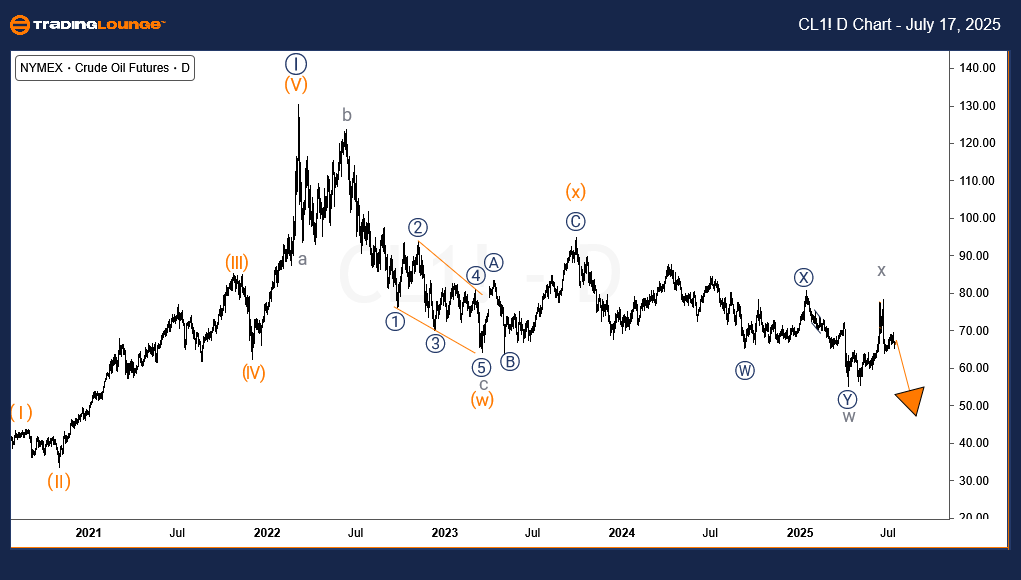
WTI Elliott Wave analysis – Daily chart

The daily chart of WTI shows the commodity engaged in a long-term corrective decline since March 2022. This movement is correcting the impulsive rise that began in April 2020. The current correction is forming a double zigzag pattern, with wave (w) and wave (x) completed in March 2023 and September 2023, respectively.

Wave (y) is actively unfolding. Within this leg, wave w and x of (y) concluded in April 2025 and June 2025. The final wave y of (y) appears underway and could push prices further below $50 in the near term.

Chart

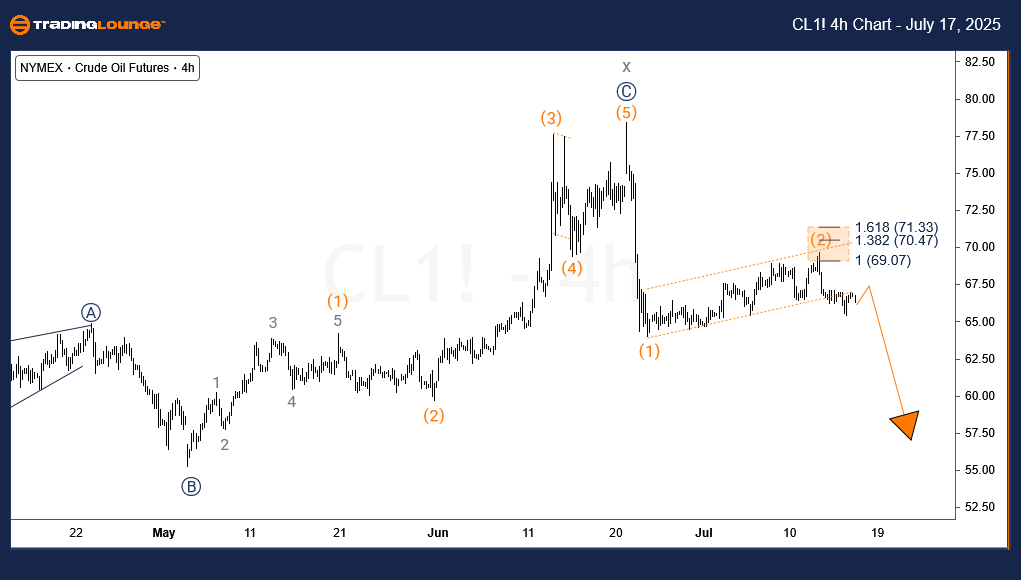
WTI Elliott Wave analysis – Four-hour chart

The H4 chart reveals further short-term bearish structure. WTI appears to have completed waves (1) and (2) of ((A)) of wave y. As long as the price remains below the $69.7 level (wave (2) high) and more significantly, under $78.4 (wave x high), selling pressure is likely to dominate.

Wave (3) of ((A)) could push prices down toward the $49–$46 range. Sustained trading beneath these key resistance levels would reinforce the bearish momentum expected in the coming weeks.

Chart

Crude Oil Elliott Wave technical analysis [Video]

Author

Peter Mathers

Peter Mathers

TradingLounge

Peter Mathers started actively trading in 1982. He began his career at Hoei and Shoin, a Japanese futures trading company.

More from Peter Mathers
Share:

Markets move fast. We move first.

Orange Juice Newsletter brings you expert driven insights - not headlines. Every day on your inbox.

By subscribing you agree to our Terms and conditions.

Editor's Picks

EUR/USD holds steady above 1.1750 as traders await FOMC Minutes

The EUR/USD pair holds steady near 1.1770 during the early Asian session on Tuesday. Traders continue to price in the prospect of further rate cuts by the US Federal Reserve in 2026, following the 25-basis-point rate reduction delivered at the December meeting. The release of the Federal Open Market Committee Minutes will be in the spotlight later on Tuesday.

GBP/USD finds key support near 1.35 despite year-end grind

GBP/USD remains bolstered on the high end as markets grind through the last trading week of the year. Cable caught a bullish tilt to keep price action on the high side of the 1.3500 handle, though year-end holiday volumes are unlikely to see significant progress in either direction as 2025 draws to a close.

Gold rebounds to near $4,350 after Monday's 4+% correction

Gold is bouncing to near $4,350 early Tuesday, helped by renewed US Dollar weakness and a dismal mood. Gold was hit sharply by profit-taking on Monday during US trading hours and retreated towards $4,300, where buyers reappeared.

Crypto market outlook for 2026

Year 2025 was volatile, as crypto often is.  Among positive catalysts were favourable regulatory changes in the U.S., rise of Digital Asset Treasuries, adoption of AI and tokenization of Real-World-Assets.

Economic outlook 2026-2027 in advanced countries: Solidity test

After a year marked by global economic resilience and ending on a note of optimism, 2026 looks promising and could be a year of solid economic performance. In our baseline scenario, we expect most of the supportive factors at work in 2025 to continue to play a role in 2026.

Crypto market outlook for 2026

Year 2025 was volatile, as crypto often is.  Among positive catalysts were favourable regulatory changes in the U.S., rise of Digital Asset Treasuries (DAT), adoption of AI and tokenization of Real-World-Assets (RWA).