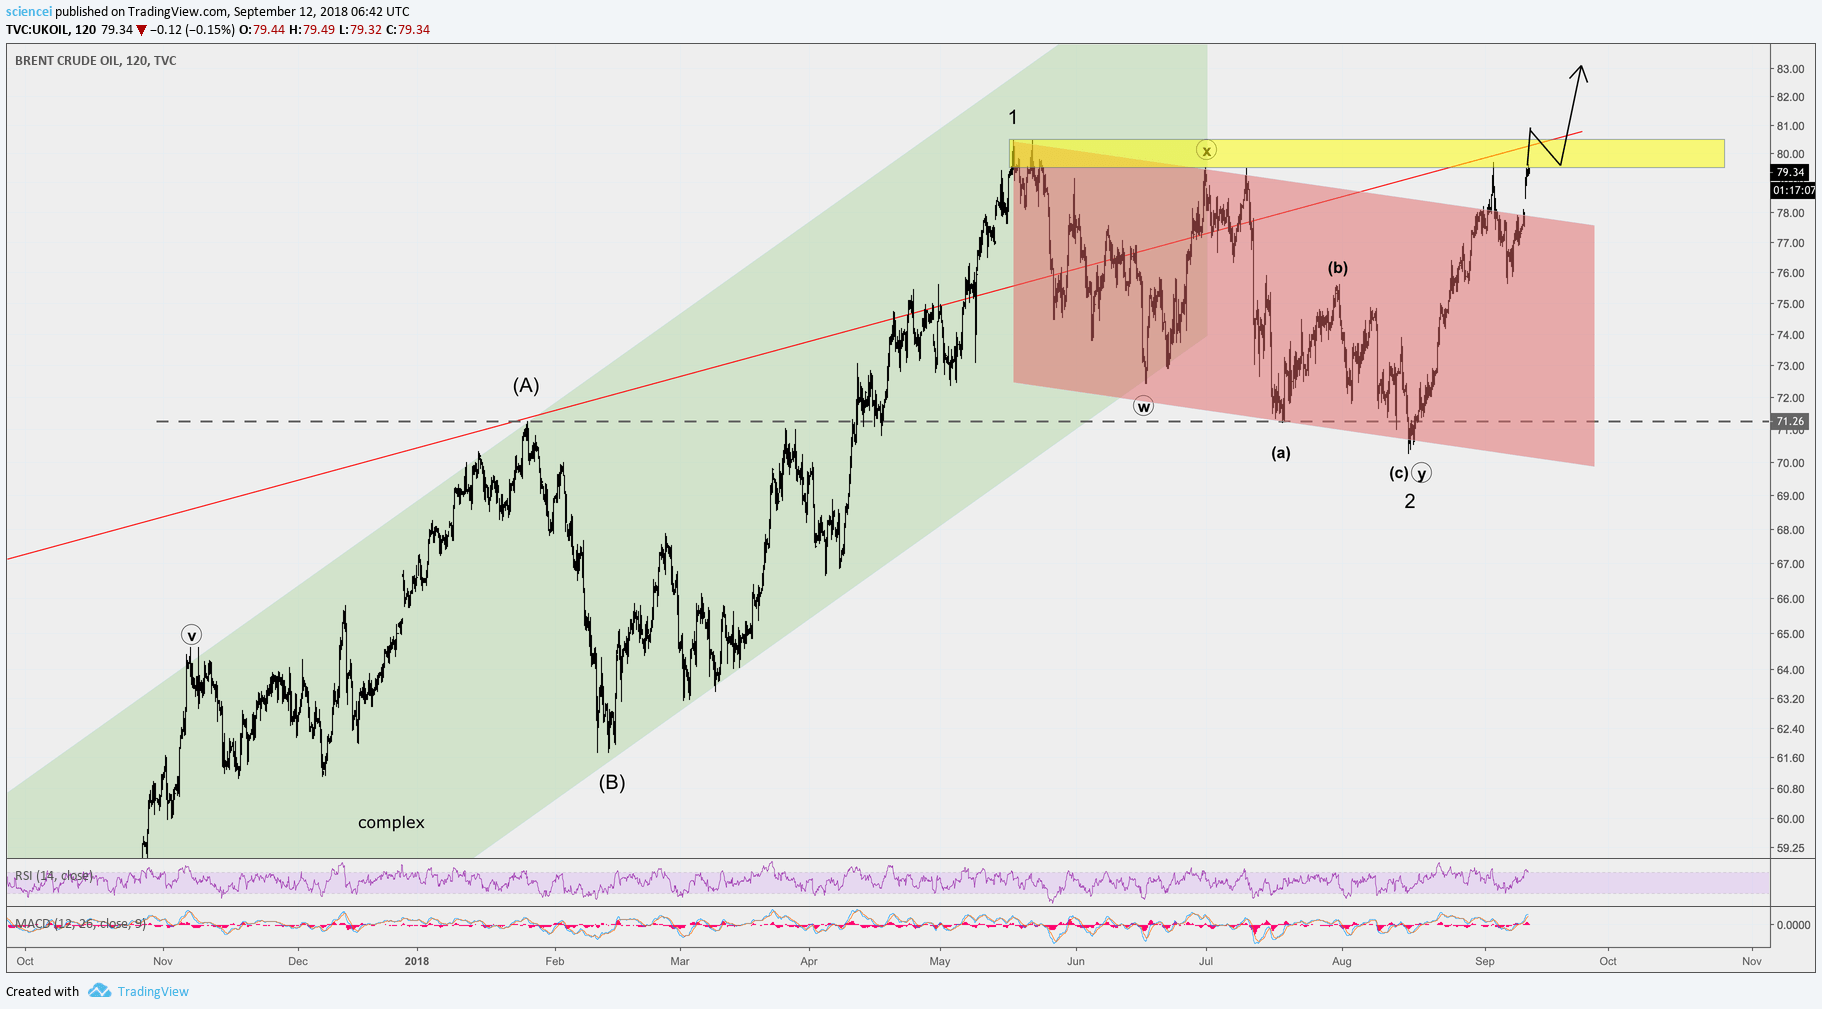
An important support and resistance cluster has been met in Brent crude oil. It is marked by the yellow horizontal bar in the chart below. Price action knocked 6 times into that bar. Brent crude oil traded range bound all the way back to May 2018. The 79.50-80.50 price range held firm and Brent couldn’t pass through. It is a bullish sign if the Brent contract passes through that area within the next few trading days.

The Brent crude contract came very close to its 52-week high this week. A three-wave correction is the best interpretation of the drop into early September 2018. Subsequent wave action looks impulsive but has not been confirmed as such yet. Followthrough to the upside will most likely bring Brent to a new high.

Our real-time interpretation is that Brent trades inside a third wave to the upside if the yellow cluster gets passed. A swift upside continuation results as of that. All in all, we turn short-term bullish on crude as soon as the yellow support and resistance cluster gets run over to the upside.

Brent


Interested in more of our ideas? Check out Scienceinvesting for more details!

The above is a matter of opinion provided for general information purposes only and is not intended as investment advice. Information and analysis above are derived from sources and utilising methods believed to be reliable, but we cannot accept responsibility for any losses you may incur as a result of this analysis. Individuals should consult with their personal financial advisors. Reproduction without ESI Analytics’ prior consent is strictly forbidden.

Recommended Content


Recommended Content

Editors’ Picks

AUD/USD remained bid above 0.6500

AUD/USD remained bid above 0.6500

AUD/USD extended further its bullish performance, advancing for the fourth session in a row on Thursday, although a sustainable breakout of the key 200-day SMA at 0.6526 still remain elusive.

AUD/USD News

EUR/USD faces a minor resistance near at 1.0750

EUR/USD faces a minor resistance near at 1.0750

EUR/USD quickly left behind Wednesday’s small downtick and resumed its uptrend north of 1.0700 the figure, always on the back of the persistent sell-off in the US Dollar ahead of key PCE data on Friday.

EUR/USD News

Gold holds around $2,330 after dismal US data

Gold holds around $2,330 after dismal US data

Gold fell below $2,320 in the early American session as US yields shot higher after the data showed a significant increase in the US GDP price deflator in Q1. With safe-haven flows dominating the markets, however, XAU/USD reversed its direction and rose above $2,340.

Gold News

Bitcoin price continues to get rejected from $65K resistance as SEC delays decision on spot BTC ETF options

Bitcoin price continues to get rejected from $65K resistance as SEC delays decision on spot BTC ETF options

Bitcoin (BTC) price has markets in disarray, provoking a broader market crash as it slumped to the $62,000 range on Thursday. Meanwhile, reverberations from spot BTC exchange-traded funds (ETFs) continue to influence the market.

Read more

US economy: slower growth with stronger inflation

US economy: slower growth with stronger inflation

The dollar strengthened, and stocks fell after statistical data from the US. The focus was on the preliminary estimate of GDP for the first quarter. Annualised quarterly growth came in at just 1.6%, down from the 2.5% and 3.4% previously forecast.

Read more

Majors

Cryptocurrencies

Signatures