Crisis averted
USD: Jun '23 is Up at 104.260.
Energies: Jul '23 Crude is Up at 73.05.
Financials: The Sep '23 30 Year T-Bond is Down 26 ticks and trading at 127.04.
Indices: The Jun '23 S&P 500 emini ES contract is 4 ticks Higher and trading at 4289.00.
Gold: The Aug'23 Gold contract is trading Down at 1960.00. Gold is 96 ticks Lower than its close.
Initial conclusion
This is not a correlated market. The USD is Up, Crude is Up which is not normal, and the 30 Year T-Bond is trading Lower. The Financials should always correlate with the US dollar such that if the dollar is Higher, then the bonds should follow and vice-versa. The S&P is Higher, and Crude is trading Higher which is not correlated. Gold is trading Lower which is correlated with the US dollar trading Up. I tend to believe that Gold has an inverse relationship with the US Dollar as when the US Dollar is down, Gold tends to rise in value and vice-versa. Think of it as a seesaw, when one is up the other should be down. I point this out to you to make you aware that when we don't have a correlated market, it means something is wrong. As traders you need to be aware of this and proceed with your eyes wide open. At the present time all of Asia is trading Higher. Europe is trading Mixed.
Possible challenges to traders today
-
Final Services PMI is out at 9:45 AM EST. This is Major.
-
ISM Services PMI is out at 10 AM EST. This is Major.
-
Factory Orders m/m is out at 10 AM EST. This is Major.
Treasuries
Traders, please note that we've changed the Bond instrument from the 30 year (ZB) to the 10 year (ZN). They work exactly the same.
We've elected to switch gears a bit and show correlation between the 10-year bond (ZN) and the S&P futures contract. The S&P contract is the Standard and Poor's, and the purpose is to show reverse correlation between the two instruments. Remember it's likened to a seesaw, when up goes up the other should go down and vice versa.
On Friday the ZN migrated Lower at around 10 AM EST as the S&P hit a Low at around the same time. If you look at the charts below the ZN gave a signal at around 10 AM and the ZN continued its Downward trend. Look at the charts below and you'll see a pattern for both assets. S&P hit a Low at around 10 AM and migrated Higher. These charts represent the newest version of MultiCharts and I've changed the timeframe to a 15-minute chart to display better. This represented a Short opportunity on the 10-year note, as a trader you could have netted about 60 ticks per contract on this trade. Each tick is worth $15.625. Please note: the front month for the ZN is now Jun '23. The S&P contract is also Jun' 23. I've changed the format to filled Candlesticks (not hollow) such that it may be more apparent and visible.
Charts courtesy of MultiCharts built on an AMP platform
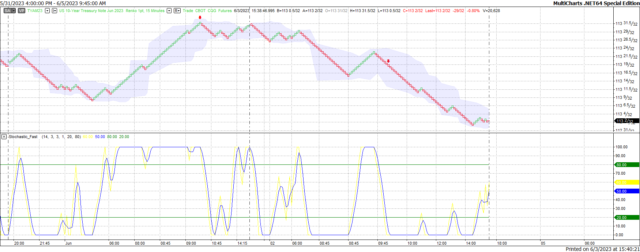
ZN - Jun 2023 - 6/02/23
-638215611652128750.png)
S&P - Jun 2023 - 6/02/23
Bias
On Friday we gave the markets a Neutral or Mixed bias as it was Jobs Friday. The markets migrated to the Upside based on the economic news (Jobs numbers) reported. The Dow gained 701 points and the other indices gained ground as well. Today we aren't dealing with a correlated market and our bias is Neutral or Mixed.
Could this change? Of Course. Remember anything can happen in a volatile market.
Commentary
I appears that the Senate liken to the House of Representatives passed the debt ceiling measure by a vote of 63 to 36 and President Biden has signed this bill into law. This law protects Social Security, Medicare, Veterans Benefits and the Defense budget. It also means no debt ceiling battle will be waged until 2025 so as to allow the Presidential campaign free rein without the interference of a debt ceiling battle. I also means that the US government will not default on it's obligations. In other news the job numbers came in far better than expected with actual job created coming in at 339,000 versus 193,000 expected. This bolstered the markets with the Dow gaining over 700 points and the other indices gained ground as well. Today we have ISM numbers and Factory Orders, all of which are Major. Will this be enough to propel the markets forward? As in all things, only time will tell.
Author

Nick Mastrandrea
Market Tea Leaves


