CPI wrong direction

USD: Mar '24 is Up at 102.210.
Energies: Feb '24 Crude is Up at 74.75.
Financials: The Mar '24 30 Year T-Bond is Down 9 ticks and trading at 122.14.
Indices: The Dec '23 S&P 500 emini ES contract is 56 ticks Lower and trading at 4801.50.
Gold: The Feb'24 Gold contract is trading Up at 2054.20.
Initial conclusion
This is not a correlated market. The USD is Up and Crude is Up which is not normal, but the 30 Year T-Bond is trading Lower. The Financials should always correlate with the US dollar such that if the dollar is Higher, then the bonds should follow and vice-versa. The S&P is Lower and Crude is trading Higher which is correlated. Gold is trading Higher which is not correlated with the US dollar trading Up. I tend to believe that Gold has an inverse relationship with the US Dollar as when the US Dollar is down, Gold tends to rise in value and vice-versa. Think of it as a seesaw, when one is up the other should be down. I point this out to you to make you aware that when we don't have a correlated market, it means something is wrong. As traders you need to be aware of this and proceed with your eyes wide open. All of Asia is trading Mixed. Currently all of Europe is trading Higher.
Possible challenges to traders
-
Core PPI m/m is out at 8:30 AM EST. This is Major.
-
PPI m/m is out at 8:30 AM EST. This is Major.
Treasuries
Traders, please note that we've changed the Bond instrument from the 30 year (ZB) to the 10 year (ZN). They work exactly the same.
We've elected to switch gears a bit and show correlation between the 10-year bond (ZN) and the S&P futures contract. The S&P contract is the Standard and Poor's, and the purpose is to show reverse correlation between the two instruments. Remember it's likened to a seesaw, when up goes up the other should go down and vice versa.
Yesterday the ZN migrated Lower at around 8:30 AM EST as the S&P hit a Low at around the same time. If you look at the charts below the S&P gave a signal at around 8:30 AM and the ZN started its Downward trend. Look at the charts below and you'll see a pattern for both assets. S&P hit a Low at around 9 AM and migrated Higher. These charts represent the newest version of MultiCharts and I've changed the timeframe to a 15-minute chart to display better. This represented a Short opportunity on the 10-year note, as a trader you could have netted about 20 plus ticks per contract on this trade. Each tick is worth $15.625. Please note: the front month for the ZN is now Mar '24. The S&P contract is now Mar' 24. I've changed the format to filled Candlesticks (not hollow) such that it may be more apparent and visible.
Charts courtesy of MultiCharts built on an AMP platform
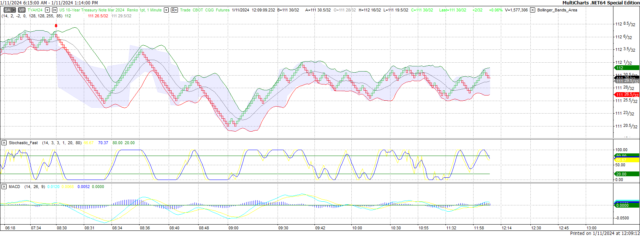
ZN - Mar 2024 - 01/11/24
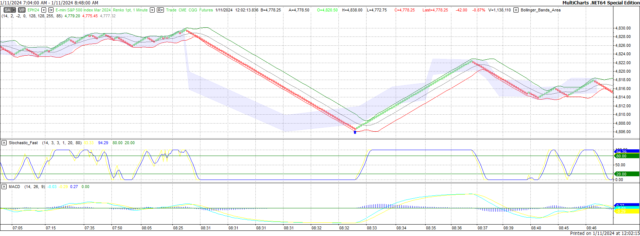
S&P - Mar 2024 - 01/11/24
Bias
Yesterday we gave the markets an Upside bias as the USD was Lower and the S&P was Higher Thursday morning. This usually reflects an Upside Day and the indices nearly complied. The Dow traded 15 points Higher, the Nasdaq broke even, and the S&P dropped 3 points. Not much to say the least. Today we aren't dealing with a correlated market and our bias is to the Downside.
Could this change? Of Course. Remember anything can happen in a volatile market.
Commentary
So yesterday we gave the markets an Upside bias and the indices nearly complied. So what happened? At 8:30 AM EST the CPI numbers came out and whereas they weren't terrible; they weren't going in the right direction. All CPI numbers showed gains and whereas ordinarily you want to see gains in reports, these numbers reflected prices going Higher not Lower meaning inflation is still with us. Yes some prices have gone down (like gasoline) but food prices have risen. Ask anyone who does food shopping week in and week out and all you'll hear is how high they keep going. Not good and certainly the Fed will take notice of this. We all expected an early interest rate reduction. This may be postponed for a while. This is not to say that rate reduction won't happen this calendar year as we think the Fed will cut rates. We just think it will happen later as opposed to sooner. Today we are light on economic news as we have the PPI numbers out today. Think of it as CPI for producers. Monday is Martin Luther King Day so we will be back on Tuesday, January 16th.
Author

Nick Mastrandrea
Market Tea Leaves


