CPI number - Mixed market

USD: Dec '24 is Down at 106.565.
Energies: Jan '25 Crude is Up at 70.41.
Financials: The Mar '25 30 Year T-Bond is Down 13 ticks and trading at 117.24.
Indices: The Dec '24 S&P 500 emini ES contract is 41 ticks Lower and trading at 6082.50.
Gold: The Feb'25 Gold contract is trading Down at 2742.60.
Initial conclusion
This is not a correlated market. The USD is Down and Crude is Up which is normal, and the 30 Year T-Bond is trading Lower. The Financials should always correlate with the US dollar such that if the dollar is Higher, then the bonds should follow and vice-versa. The S&P is Lower and Crude is trading Higher which is correlated. Gold is trading Lower which is not correlated with the US dollar trading Down. I tend to believe that Gold has an inverse relationship with the US Dollar as when the US Dollar is down, Gold tends to rise in value and vice-versa. Think of it as a seesaw, when one is up the other should be down. I point this out to you to make you aware that when we don't have a correlated market, it means something is wrong. As traders you need to be aware of this and proceed with your eyes wide open. Asia traded Higher with the exception of the Indian Sensex exchange. Europe is trading Mixed.
Possible challenges to traders
-
Core PPI m/m is out at 8:30 AM EST. This is Major.
-
PPI m/m is out at 8:30 AM EST. This is Major.
-
Unemployment Claims is out at 8:30 AM EST. This is Major.
-
Natural Gas Storage is out at 10:30 AM EST. This is Major.
-
30 Year Bond Auction starts at 1 PM EST. This is Major.
Traders, please note that we've changed the Bond instrument from the 10 year (ZN) to the 2 year (ZT). They work exactly the same.
We've elected to switch gears a bit and show correlation between the 2-year Treasury notes (ZT) and the S&P futures contract. The YM contract is the Dow Jones Industrial Average, and the purpose is to show reverse correlation between the two instruments. Remember it's likened to a seesaw, when up goes up the other should go down and vice versa.
Yesterday the ZT migrated Higher at around 8:30 AM EST after the CPI numbers were released. The Dow dived Lower at the same time. Look at the charts below and you'll see a pattern for both assets. The Dow moved Lower at 8:30 AM and the ZT moved Higher at around the same time. These charts represent the newest version of Bar Charts, and I've changed the timeframe to a 15-minute chart to display better. This represented a Long opportunity on the 2-year note, as a trader you could have netted about 30 plus ticks per contract on this trade. Each tick is worth $7.625. Please note: the front month for ZT is now Mar '25 and the Dow is still Dec '24. I've changed the format to filled Candlesticks (not hollow) such that it may be more apparent and visible.
Charts courtesy of Barcharts
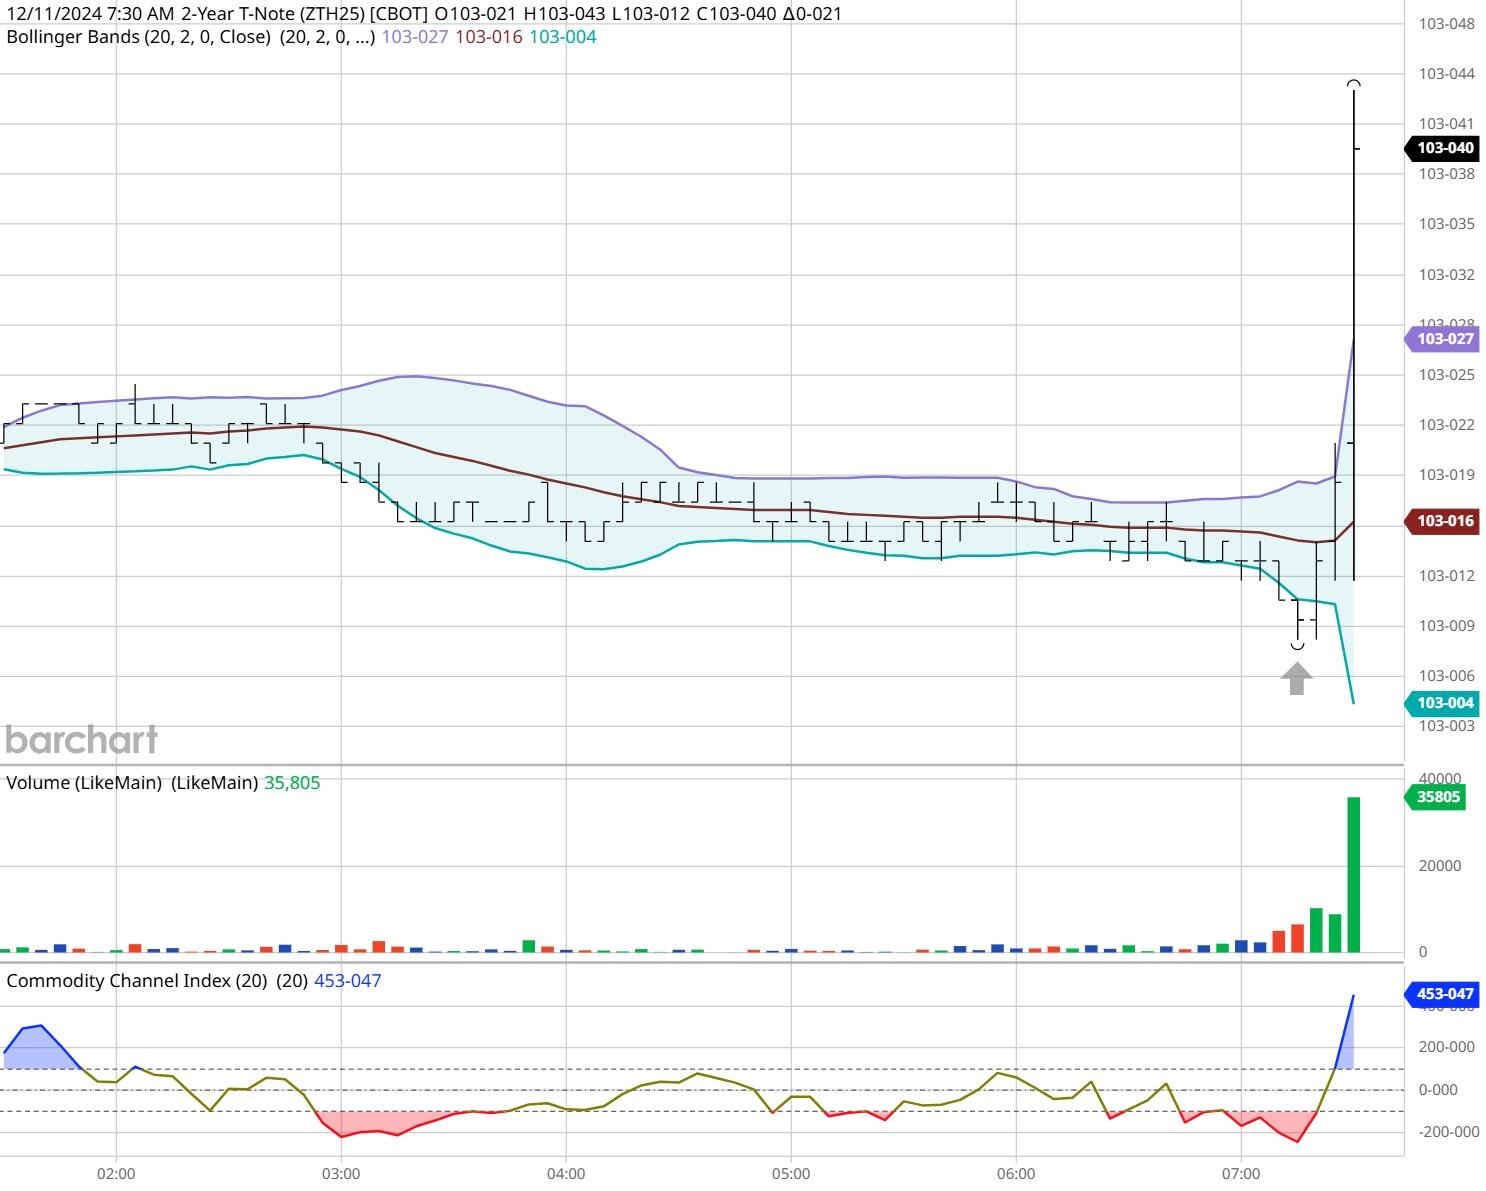
ZT -Mar 2025 - 12/11/24
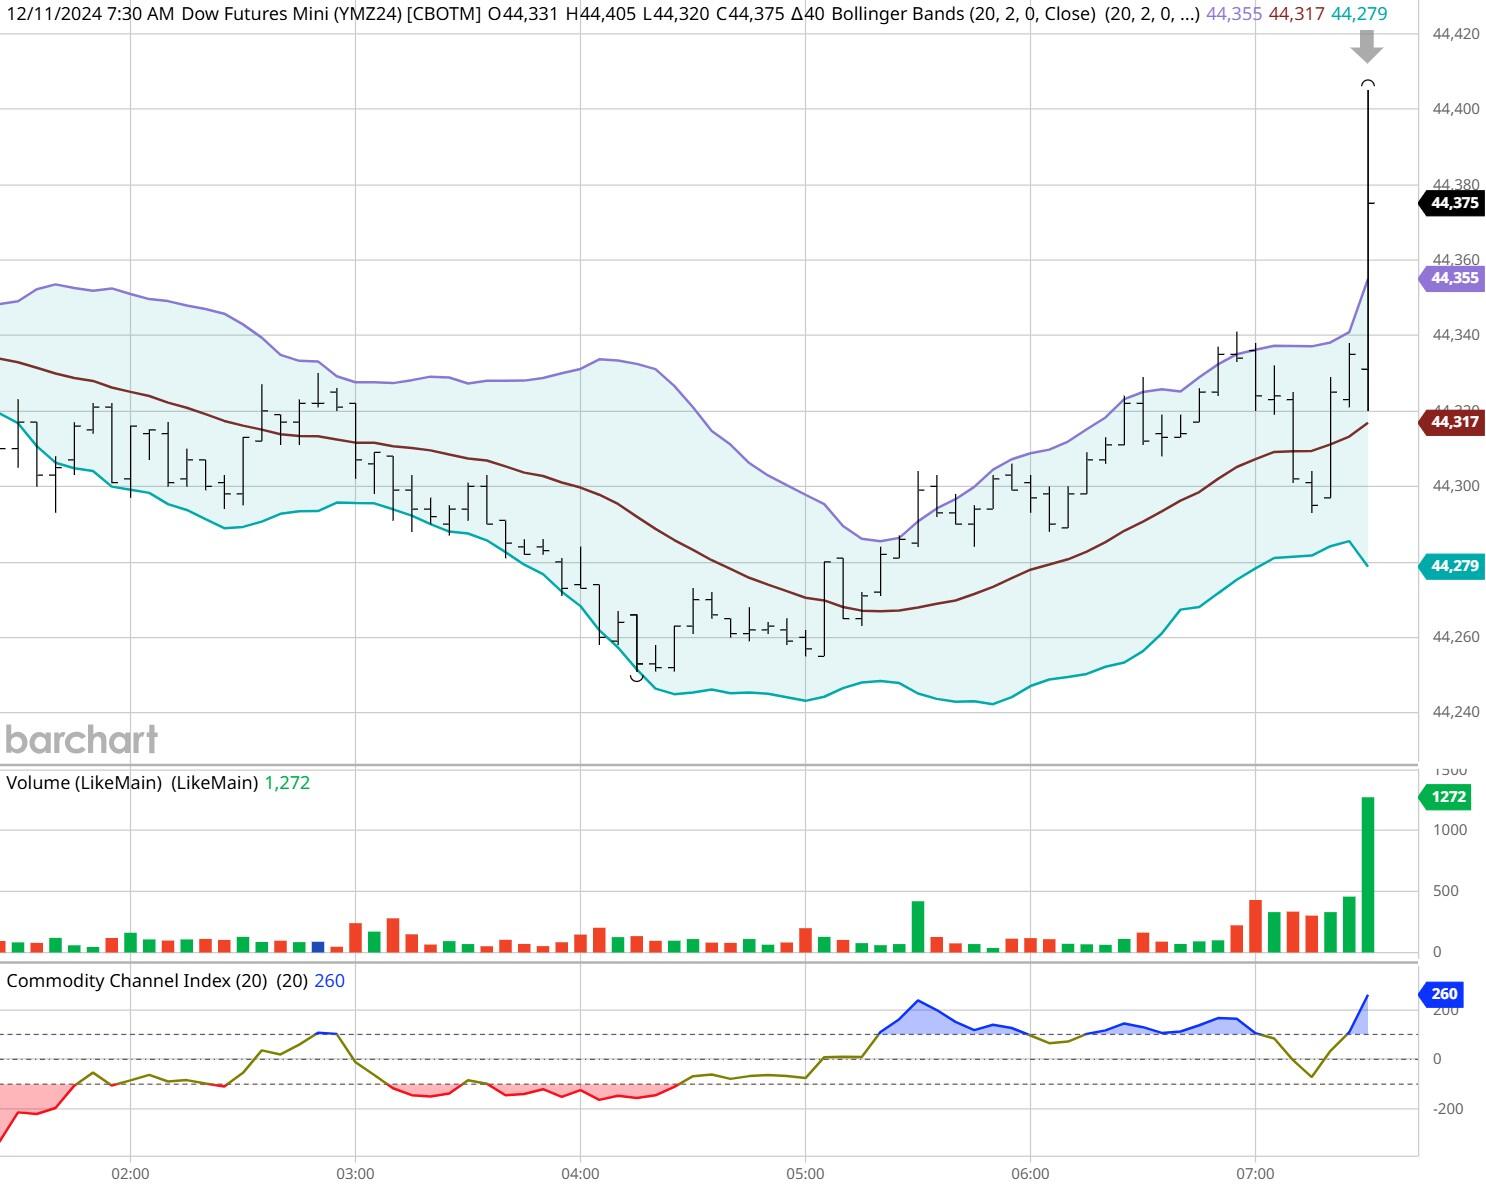
Dow - Dec 2024- 12/11/24
Bias
Yesterday we gave the markets a Mixed bias and the markets didn't disappoint. The Dow closed Lower by 99 points, but the other indices closed Higher. Today we aren't dealing with a correlated market and will maintain a Neutral or Mixed bias.
Could this change? Of Course. Remember anything can happen in a volatile market.
Commentary
Yesterday the all-important CPI numbers were released Wednesday, and it showed the year over year CPI number increased to 2.7% versus the 2.6% predicted. This market isn't very forgiving when it comes to a missed number regardless of how small. Today we have PPI which are in effect CPI numbers for producers and suppliers. It will show the rate of inflation that producers must pay for raw materials or components.
Author

Nick Mastrandrea
Market Tea Leaves


