CPI = Mixed Market [Video]
![CPI = Mixed Market [Video]](https://editorial.fxstreet.com/images/Macroeconomics/EconomicIndicator/Prices/CPI/tablet-with-consumer-price-index-cpi-business-concept-gm499730392-80399281_XtraLarge.jpg)
US Dollar: March USD is Up at 96.925.
Energies: April '19 Crude is Up at 57.17.
Financials: The Jun 30 year bond is Down 6 ticks and trading at 146.07.
Indices: The Mar S&P 500 emini ES contract is 7 ticks Lower and trading at 2795.50.
Gold: The April Gold contract is trading Up at 1306.00 Gold is 75 ticks Higher than its close.
Initial Conclusion
This is not a correlated market. The dollar is Up+ and Crude is Up+ which is not normal and the 30 year Bond is trading Lower. The Financials should always correlate with the US dollar such that if the dollar is lower then bonds should follow and vice-versa. The S&P is Higher and Crude is trading Higher which is not correlated. Gold is trading Higher which is not correlated with the US dollar trading Higher. I tend to believe that Gold has an inverse relationship with the US Dollar as when the US Dollar is down, Gold tends to rise in value and vice-versa. Think of it as a seesaw, when one is up the other should be down. I point this out to you to make you aware that when we don't have a correlated market, it means something is wrong. As traders you need to be aware of this and proceed with your eyes wide open.
At this hour all of Asia is trading Lower with the exception of the Indian Sensex. Currently Europe is trading Mixed.
Possible Challenges To Traders Today
-
Core Durable Goods Orders is out at 8:30 AM EST. This is major.
-
Durable Goods Orders is out at 8:30 AM EST. This is major.
-
PPI is out at 8:30 AM EST. This is major.
-
Core PPI is out at 8:30 AM EST. This is major.
-
Construction Spending is out at 10 AM EST. This is major.
-
Crude Oil Inventories is out at 10:30 AM EST. Major.
-
30-y Bond Auction starts at 1 PM EST. This is major.
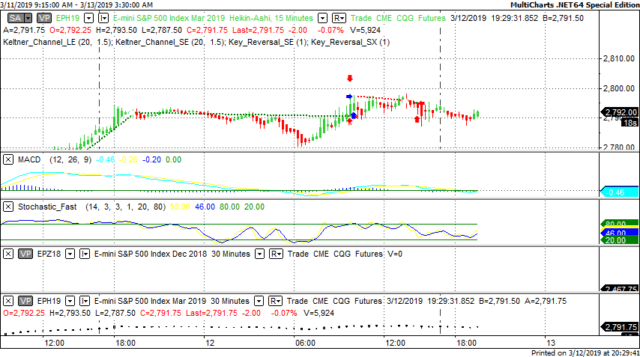
Treasuries
We've elected to switch gears a bit and show correlation between the 30 year bond (ZB) and The YM futures contract. The YM contract is the DJIA and the purpose is to show reverse correlation between the two instruments. Remember it's liken to a seesaw, when up goes up the other should go down and vice versa.
Yesterday the ZB made a major move at around 9:45 AM EST. The ZB hit a Low at around that time and the YM hit a High. If you look at the charts below ZB gave a signal at around 9:45 AM EST and the YM was moving Lower at the same time. Look at the charts below and you'll see a pattern for both assets. ZB hit a Low at around 9:45 AM and the YM was moving Lower at the same time. These charts represent the newest version of MultiCharts and I've changed the timeframe to a 15 minute chart to display better. This represented a Long opportunity on the 30 year bond, as a trader you could have netted about 20 ticks per contract on this trade. Each tick is worth $31.25. Please note: the front month for the ZB contract is now June, 2019
Charts Courtesy of MultiCharts built on an AMP platform.
Bias
Yesterday we gave the markets an Upside bias as both the USD and the Bonds were trading Lower yesterday morning and this usually reflects an Upside day. The markets closed Mixed yesterday with the Dow down by 96 points and the other indices closed Higher. Today we aren't dealing with a correlated market and our bias is Neutral.
Could this change? Of Course. Remember anything can happen in a volatile market.
Commentary
Yesterday by any means it appeared as though the markets would gravitate to the upside as both the USD and the Bonds were trading Lower. Then CPI data was released and thereafter the Dow went and stayed in negative territory for the remainder of the session. Today we have PPI data out which reflects Producer Price Index and is a bellwether to determine if producers will raise prices. We also have Construction Spending out at 10 AM EST.
Author

Nick Mastrandrea
Market Tea Leaves


