CPI down, but not enough to lower
USD: Jun '24 is Up at 104.870.
Energies: Jul '24 Crude is Down at 77.95.
Financials: The Sept '24 30 Year T-Bond is Down 13 ticks and trading at 118.24.
Indices: The Jun '24 S&P 500 emini ES contract is 23 ticks Higher and trading at 5433.25.
Gold: The Jun'24 Gold contract is trading Down at 2326.00
Initial conclusion
This is not a correlated market. The USD is Up and Crude is Down which is normal, but the 30 Year T-Bond is trading Up. The Financials should always correlate with the US dollar such that if the dollar is Higher, then the bonds should follow and vice-versa. The S&P is Higher and Crude is trading Lower which is correlated. Gold is trading Lower which is correlated with the US dollar trading Up. I tend to believe that Gold has an inverse relationship with the US Dollar as when the US Dollar is down, Gold tends to rise in value and vice-versa. Think of it as a seesaw, when one is up the other should be down. I point this out to you to make you aware that when we don't have a correlated market, it means something is wrong. As traders you need to be aware of this and proceed with your eyes wide open. Asia is trading Mixed with half the exchanges trading Higher and the other half Lower. Currently all of Europe is trading Lower.
Possible challenges to traders
-
Core PPI m/m is out at 8:30 AM EST. This is Major.
-
PPI m/m is out at 8:30 AM EST. This is Major.
-
Unemployment Claims are out at 8:30 AM EST. This is Major.
-
Natural Gas Storage is out at 10:30 AM EST. This is Major.
-
Treasury Sec Yellen Speaks at 12 Noon EST. This is Major.
-
FOMC Member Williams Speaks at 12 Noon EST. This is Major.
-
30-y Bond Auction starts at 1 PM EST. This is Major.
Treasuries
Traders, please note that we've changed the Bond instrument from the 10 year (ZN) to the 2 year (ZT). They work exactly the same.
We've elected to switch gears a bit and show correlation between the 10-year Treasury notes (ZN) and the S&P futures contract. The YM contract is the Dow Jones Industrial Average, and the purpose is to show reverse correlation between the two instruments. Remember it's likened to a seesaw, when up goes up the other should go down and vice versa.
Yesterday the ZT migrated Higher at around 8:30 AM EST as the Dow zoomed Lower. If you look at the charts below the ZT gave a signal at around 8:30 AM and started its Upward climb. Look at the charts below and you'll see a pattern for both assets. The Dow moved Lower at around 8:30 AM and the ZT moved Higher at around the same time. These charts represent the newest version of BarCharts and I've changed the timeframe to a 15-minute chart to display better. This represented a Long opportunity on the 2-year note, as a trader you could have netted 30 plus ticks per contract on this trade. Each tick is worth $7.625. Please note: the front month for ZT is Sept and the S&P is still Jun '24. I've changed the format to filled Candlesticks (not hollow) such that it may be more apparent and visible.
Charts courtesy of barcharts
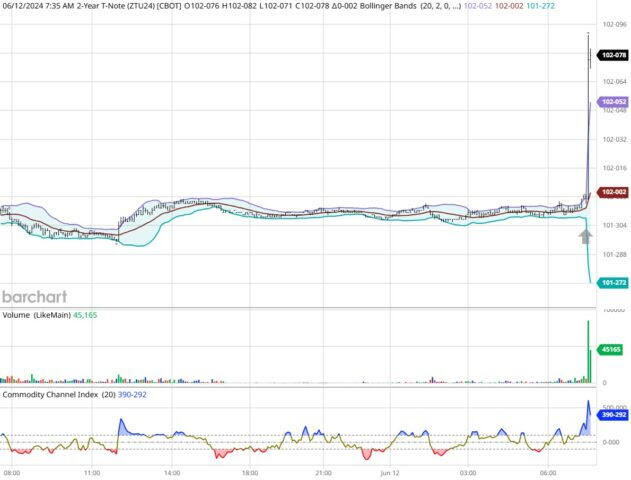
ZT -Sept 2024 - 06/12/24
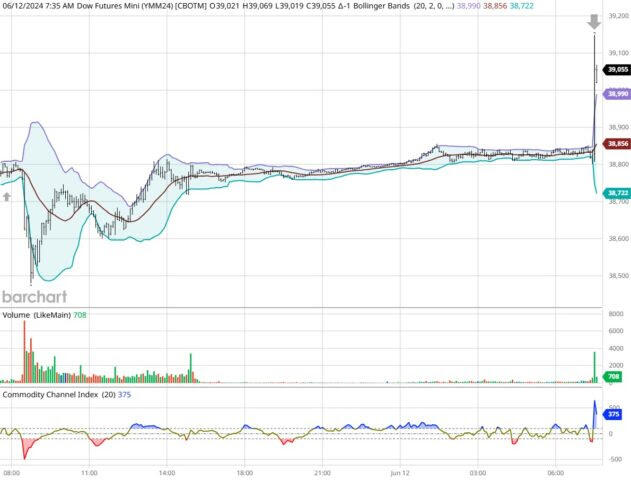
Dow - Jun 2024 - 06/12/24
Bias
Yesterday we gave the markets a Neutral or Mixed bias as it was FOMC Day, and the markets never react with any sense of Normalcy. Sure enough the Dow finished Lower by 35 points; but the S&P and Nasdaq both traded Higher and closed out the session in positive territory. Today we aren't dealing with a correlated market and our bias is Neutral or Mixed.
Could this change? Of Course. Remember anything can happen in a volatile market.
Commentary
Yesterday it was FOMC Day, and to add fuel to the fire we had CPI data out Wednesday morning prior to the Fed announcement and guess what? It seems as though the "inflation" numbers weren't as high as everyone thought they might be. The CPI year over year number came in at 3.3% versus 3.4% expected. Yet despite this improvement it wasn't enough for the Fed to consider reducing interest rates. Understand that the Federal Reserve doesn't do this directly as they don't tell banks what to charge in terms of any interest rate. They utilize something called the Federal Funds Rate, sometime known as the Overnight Rate. This is the rate that the Federal Reserve charges lending institutions as interest knowing that those lending institutions will markup that rate (the rate that we the ultimate consumer pays) and thereby net a profit. At the Press Conference yesterday Fed Chair Powell suggested that the Fed would cut rates this year but that would be data dependent. In other words, they aren't going to act unless they see more improvement. No one is clear as to what that improvement is. The economy could use a reduction in interest rates, but seems it would be easier to teach a horse how to play a piano before they do that.
Author

Nick Mastrandrea
Market Tea Leaves


