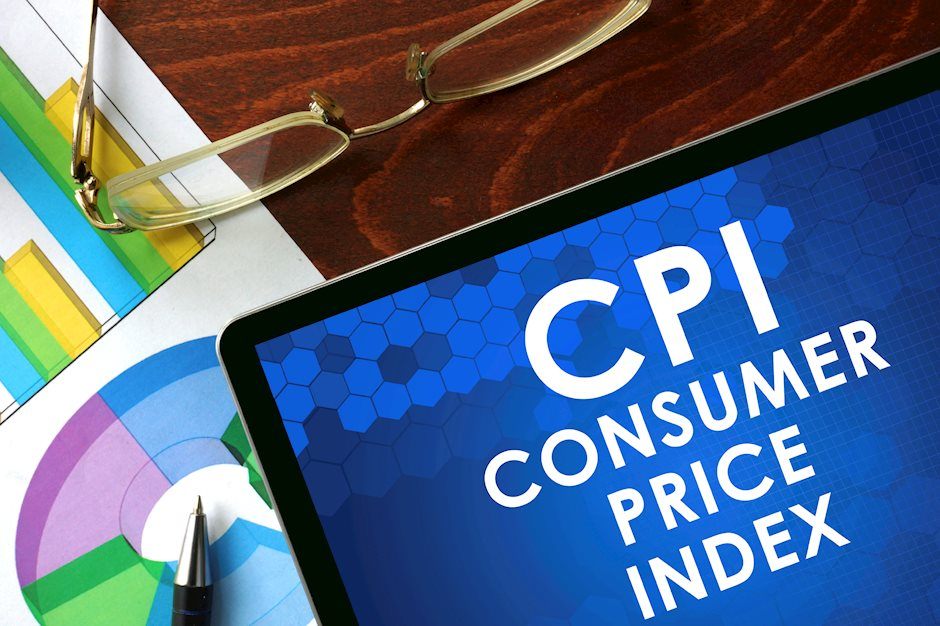
CPI data propels markets
USD: Dec '23 is Up at 104.030.
Energies: Dec '23 Crude is Down at 77.69.
Financials: The Dec '23 30 Year T-Bond is Down 10 ticks and trading at 115.04.
Indices: The Dec '23 S&P 500 emini ES contract is 61 ticks Higher and trading at 4526.25
Gold: The Dec'23 Gold contract is trading Up at 1976.70.
Initial conclusion
This is not a correlated market. The USD is Up and Crude is Down which is normal, but the 30 Year T-Bond is trading Lower. The Financials should always correlate with the US dollar such that if the dollar is Higher, then the bonds should follow and vice-versa. The S&P is Higher and Crude is trading Lower which is correlated. Gold is trading Higher which is not correlated with the US dollar trading Up. I tend to believe that Gold has an inverse relationship with the US Dollar as when the US Dollar is down, Gold tends to rise in value and vice-versa. Think of it as a seesaw, when one is up the other should be down. I point this out to you to make you aware that when we don't have a correlated market, it means something is wrong. As traders you need to be aware of this and proceed with your eyes wide open. All of Asia is trading Higher. All of Europe is trading Higher as well.
Possible challenges to traders
-
Core PPI m/m is out at 8:30 AM EST. This is Major.
-
PPI m/m is out at 8:30 AM EST. This is Major.
-
PPI y/y is out at 8:30 AM EST. This is Major.
-
Core Retail Sales m/m is out at 8:30 AM EST. This is Major.
-
Retail Sales m/m is out at 8:30 AM EST. This is Major.
-
Empire State Manufacturing Index is out at 8;30 AM EST. This is Major.
-
FOMC Member Barr Speaks at 9:30 AM EST. This is Major.
-
Business Inventories m/m are out at 10 AM. This is Major.
-
Crude Oil Inventories are out at 10:30 AM EST. This is Major.
Treasuries
Traders, please note that we've changed the Bond instrument from the 30 year (ZB) to the 10 year (ZN). They work exactly the same.
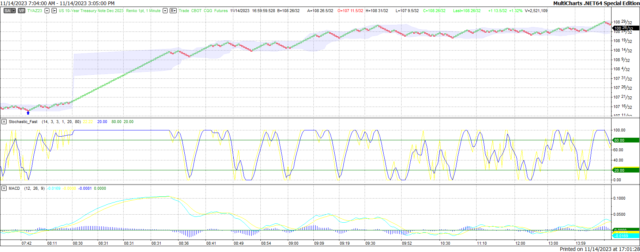
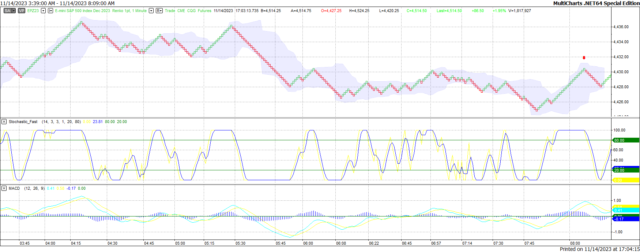
We've elected to switch gears a bit and show correlation between the 10-year bond (ZN) and the S&P futures contract. The S&P contract is the Standard and Poor's, and the purpose is to show reverse correlation between the two instruments. Remember it's likened to a seesaw, when up goes up the other should go down and vice versa. Today we aren't dealing with a correlated market and our bias is to the Upside.
Yesterday the ZN migrated Higher at around 8 AM EST as the S&P hit a High at around the same time. If you look at the charts below the S&P gave a signal at around 8 AM and the ZN started its Upward trend. Look at the charts below and you'll see a pattern for both assets. S&P hit a High at around 8 AM and migrated Lower. These charts represent the newest version of MultiCharts and I've changed the timeframe to a 15-minute chart to display better. This represented a Long opportunity on the 10-year note, as a trader you could have netted about 30 ticks per contract on this trade. Each tick is worth $15.625. Please note: the front month for the ZN is now Dec '23. The S&P contract is now Dec' 23. I've changed the format to filled Candlesticks (not hollow) such that it may be more apparent and visible.
Charts courtesy of MultiCharts built on an AMP platform
ZN - Dec 2023 - 11/14/23
S&P - Dec 2023 - 11/14/23
Bias
Yesterday we gave the markets a Neutral or Mixed bias as we didn't see much in the way of correlation Tuesday morning. However, the CPI data was released at 8:30 and the markets roared, the Dow alone jumped over 500 points on this news. The Dow closed 490 points Higher, and the other indices closed Higher as well.
Could this change? Of Course. Remember anything can happen in a volatile market.
Commentary
Yesterday the CPI data was released at 8:30 AM EST and it seems that consumer prices didn't rise much in October. They weren't reduced to be sure, and the markets took that as a successful win the Dow alone soared over 500 points based on that news. The other indices closed Higher as well. Today we have PPI data. Think of PPI data as CPI for suppliers and manufacturers. If these numbers are low, then consumer prices should be lower as well. The Federal Reserve also use this data to determine interest rate hikes as well.
Author

Nick Mastrandrea
Market Tea Leaves


