Inflation surprises and market reactions: Unraveling the CPI puzzle

US Dollar: Jun '23 USD is Up at 101.705.
Energies: May '23 Crude is Up at 73.10.
Financials: The Jun '23 30 Year T-Bond is Up 5 ticks and trading at 130.27.
Indices: The Jun '23 S&P 500 Emini ES contract is 48 ticks Higher and trading at 4164.00.
Gold: The Jun'23 Gold contract is trading Down at 2033.50. Gold is 36 ticks Lower than its close.
Initial conclusion
This is not a correlated market. The USD is Up, and Crude is Up which is not normal, and the 30 Year T-Bond is trading Higher. The Financials should always correlate with the US dollar such that if the dollar is Higher, then the bonds should follow and vice-versa. The S&P is Higher, and Crude is trading Higher which is not correlated. Gold is trading Lower which is correlated with the US dollar trading Up. I tend to believe that Gold has an inverse relationship with the US Dollar as when the US Dollar is down, Gold tends to rise in value and vice-versa. Think of it as a seesaw, when one is up the other should be down. I point this out to you to make you aware that when we don't have a correlated market, it means something is wrong. As traders you need to be aware of this and proceed with your eyes wide open. At the present time Asia is trading mainly Lower with the exception of the Nikkei exchange which is Higher. At the present time all of Europe is trading Higher. .
Possible challenges to traders today
-
PPI m/m is out at 8:30 AM EST. This is Major.
-
Core PPI is out at 8:30 AM EST. This is Major.
-
Unemployment Claims are out at 8:30 AM EST. This is Major.
-
FOMC Member Waller Speaks at 10:15 AM EST. This is Major.
-
Natural Gas Storage is out at 10:30 AM EST. This is Major.
-
30-y Bond Auction starts at 1 PM EST. This is Major.
Treasuries
Traders, please note that we've changed the Bond instrument from the 30 year (ZB) to the 10 year (ZN). They work exactly the same.
We've elected to switch gears a bit and show correlation between the 10-year bond (ZN) and the S&P futures contract. The S&P contract is the Standard and Poor's, and the purpose is to show reverse correlation between the two instruments. Remember it's likened to a seesaw, when up goes up the other should go down and vice versa.
Yesterday the ZN migrated Higher at around 8:15 AM EST but at the same time the S&P hit a High. If you look at the charts below the ZN gave a signal at around 8:15 AM and the ZN continued its Upward trend. Look at the charts below and you'll see a pattern for both assets. S&P hit a High at around 8:15 AM and migrated Lower. These charts represent the newest version of MultiCharts and I've changed the timeframe to a 15-minute chart to display better. This represented a Long opportunity on the 10-year note, as a trader you could have netted about 20 ticks per contract on this trade. Each tick is worth $15.625. Please note: the front month for the ZN is now Jun '23. The S&P contract is also Jun' 23. I've changed the format to filled Candlesticks (not hollow) such that it may be more apparent and visible.
Charts courtesy of MultiCharts built on an AMP platform
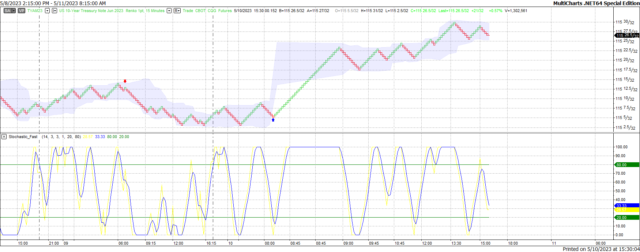
ZN - Jun 2023 - 5/10/23
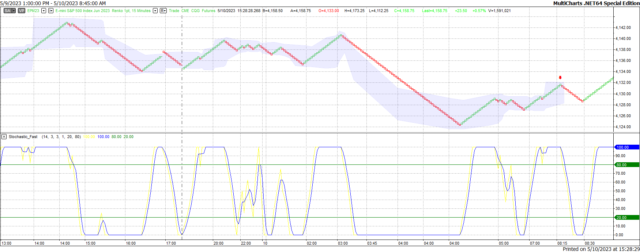
S&P - Jun 2023 - 5/10/23
Bias
Yesterday we gave the markets a Downside bias as the indices were correlated to the Downside yesterday morning. The Dow traded Lower as suggested and dropped 30 points but the other indices migrated Higher. Today we aren't dealing with a correlated market and our bias is Neutral.
Could this change? Of Course. Remember anything can happen in a volatile market.
Commentary
Yesterday CPI data was reported that showed the lowest rate of inflation with the last two years. The reading was 4.9% versus 5.0% expected. True this is not a wide gulf or larger difference, but the markets seemed to gravitate Higher based on this news. Up until the last half hour, the markets were trading completly to the Upside. Today we have PPI data as well as weekly jobless claims and an FOMC Member speaking, so time will tell how it all works out.
Author

Nick Mastrandrea
Market Tea Leaves


